Research design
Answering the research objectives is made possible by an unique research design. Along the North-South axis of Germany, so-called exploratories have been set up in three regions to conduct functional biodiversity research.
In order to comprehensively examine the relationship between land use, biodiversity and the benefits of nature for humans, a comparative approach was established. In this approach, researchers examine the different facets of how land-use intensity affects biodiversity and ecosystem functions on managed land in the real world. All research groups are based on the same study areas in forests, pastures and meadows, distributed over the three regions. Each region contains the largest part of the typical land-use types for grassland and forest in Germany.
Since the beginning of the 6th phase in 2020, additional experimental plots have been established. In our joint multi-site experiments, biodiversity is manipulated directly and indirectly across landscapes.
Characteristics of the exploratories
All three exploratories are partly located in large protected areas. Only there are hardly or unused forest and grassland areas found in sufficient numbers to be able to systematically analyse the influence of different land-use intensities on biodiversity. All three regions show the same typical land-use intensities for grassland and forests in Germany, ranging from barely managed grassland and unmanaged beech forests to highly fertilised and intensively managed meadows and pastures and intensively managed forests. They thus representatively map the land-use gradient of Germany, an important prerequisite for our studies. Besides this central commonality, the three exploratories differ in terms of geology, vegetation and climate, and thereby covering different natural areas of Germany.
The experimental design of the Biodiversity Exploratories is, firstly, a comparative approach of real managed areas and secondly, joint multi-scale experiments are carried out. Here, biodiversity is manipulated directly and indirectly.
In this experimental design, each plot is reviewed and compared by different research groups with regard to land-use intensity and its response to biodiversity. This work motivated us to establish the joint multi-site experiments.
Our study sites (plots)
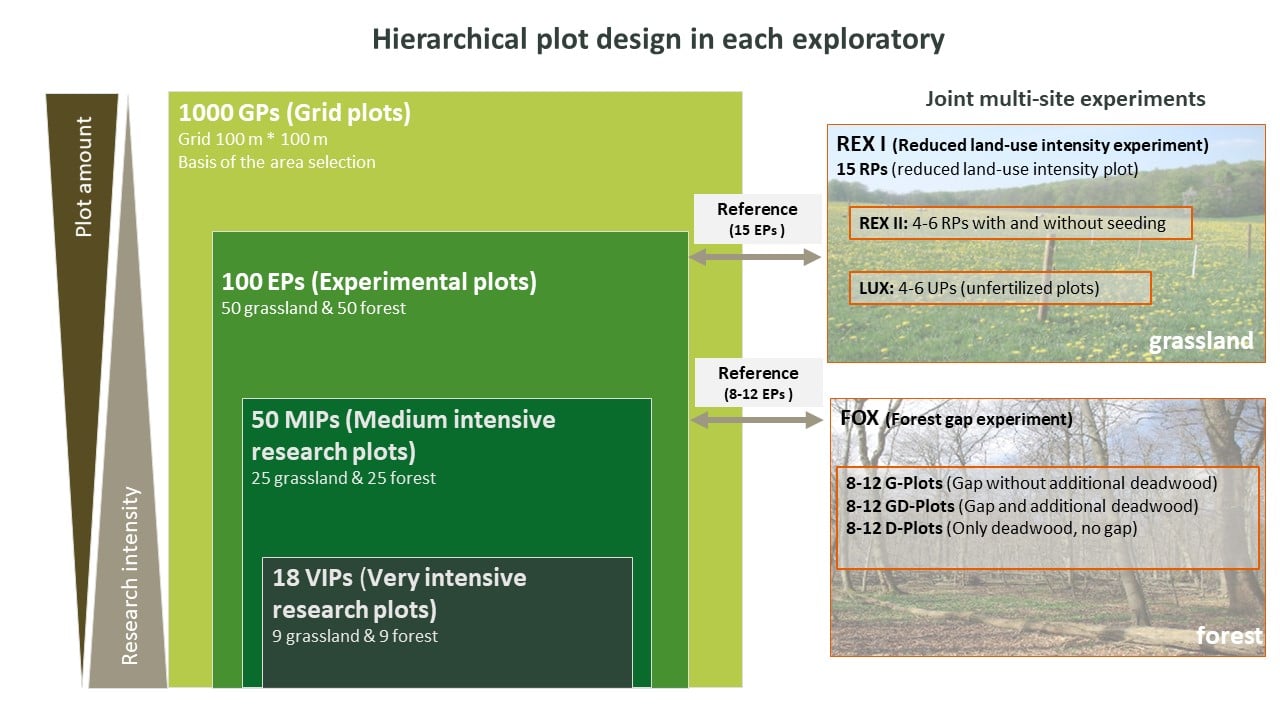
In the three exploratories, study plots have been identified on which the comparative studies will be carried out. These differ in the type of management, but should otherwise be as similar as possible (e.g., soil type). Basically, a distinction can be made between the following four categories of study plots, which build on each other (Fig.1):
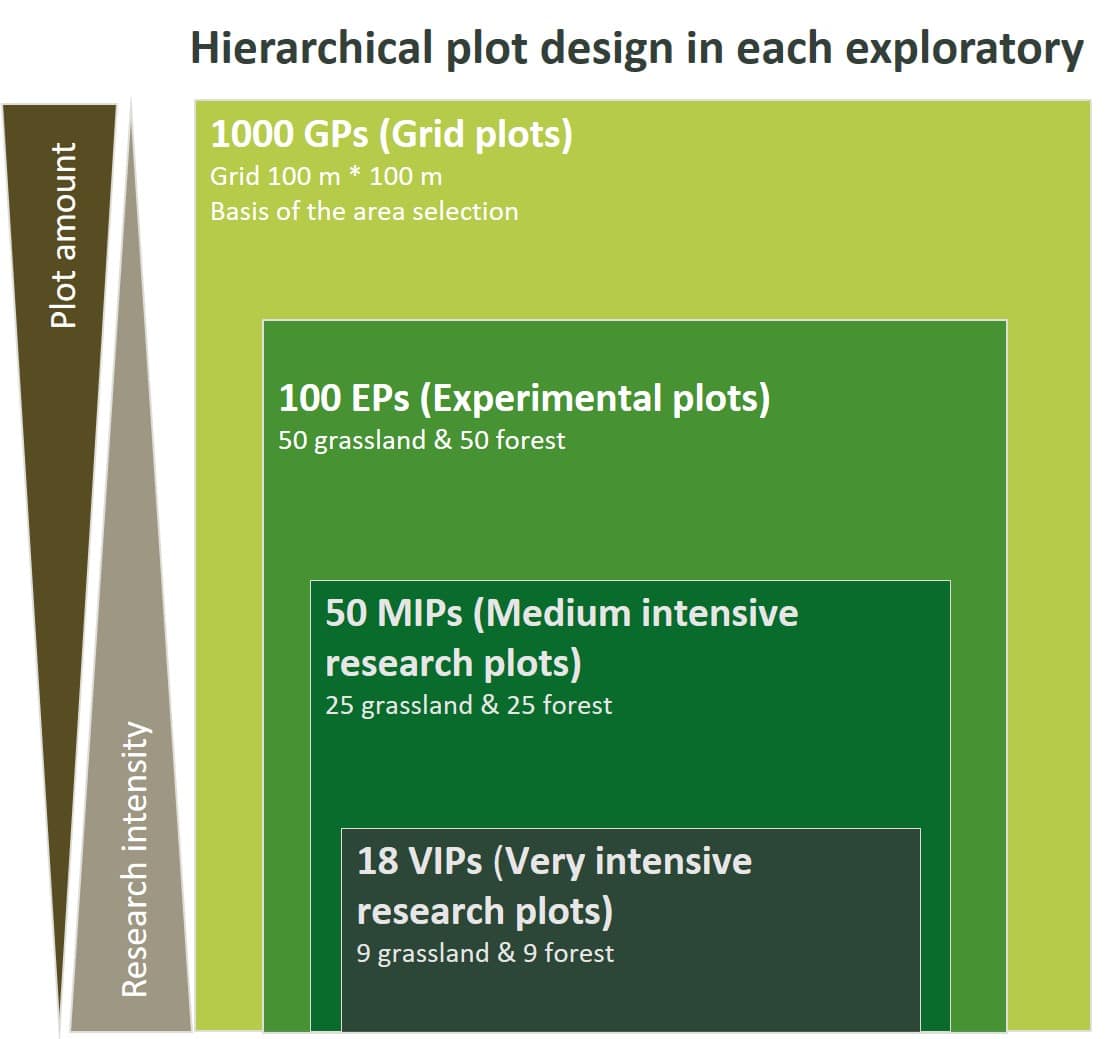
1. Grid plots (GP)
An inventory of more than 3,000 plots (1,000 per exploratory) was carried out, so that all types of grassland and forest of the respective region occur as study area (500 plots in grassland and 500 in forest per exploratory). In addition, a soil inventory and a forest and grassland inventory were carried out. These were used to determine the type of forest management and main tree species, and to determine the land-use intensity by interviewing farmers and landowners.
2. Experimental plots (EP)
Based on this information, a total of 300 study plots (100 plots per exploratory, of which 50 plots in forest with 100×100 m and 50 plots in grassland with 50×50 m) were selected for further research for detailed biodiversity mapping, environmental monitoring and manipulative experiments. The plots were selected randomly and include the whole range of land-use and management types of the respective exploratories with the smallest possible differences in soil type and other disturbance variables.
3. Plots of medium research intensity (MIP)
In 2015, a subset of 150 plots (50 plots per exploratory, 25 plots in forest and 25 plots in grassland) was selected for more labour-intensive research covering the entire gradient of land-use intensity in forest and grassland.
4. Plots of high research intensity (VIP)
Finally, a further subset of 54 plots (18 plots per exploratory, 9 plots in forest and 9 plots in grassland) was selected for very labour-intensive experiments. In the Hainich-Dün region, three more plenter forest plots were added, as this form of management has a special regional significance here.
In addition to the plot categories already described, further multi-site experiment plots were added with the start of the 6th phase (2020-2023) of the Biodiversity Exploratories, which are associated to the EPs and were established by the core projects. In these experiments, management is manipulated. These experimnets are used by various projects.
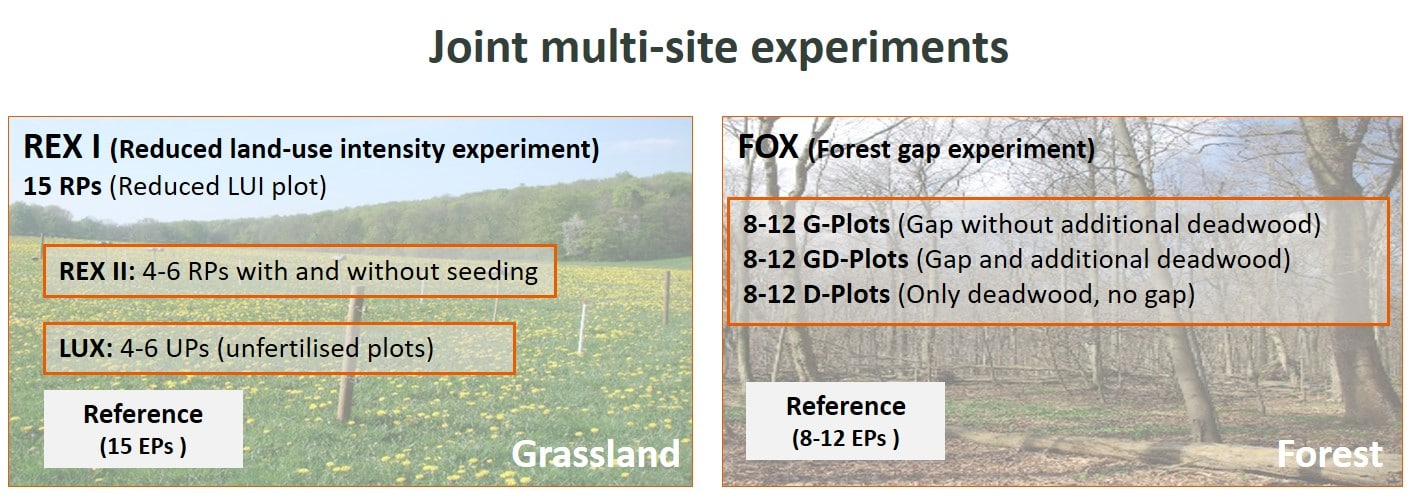
Reduced land-use intensity experiment (REX)
The background to the establishment of this experimental design was the question of whether biodiversity and ecosystem functions of intensively used grasslands can be restored by reducing land use intensity.
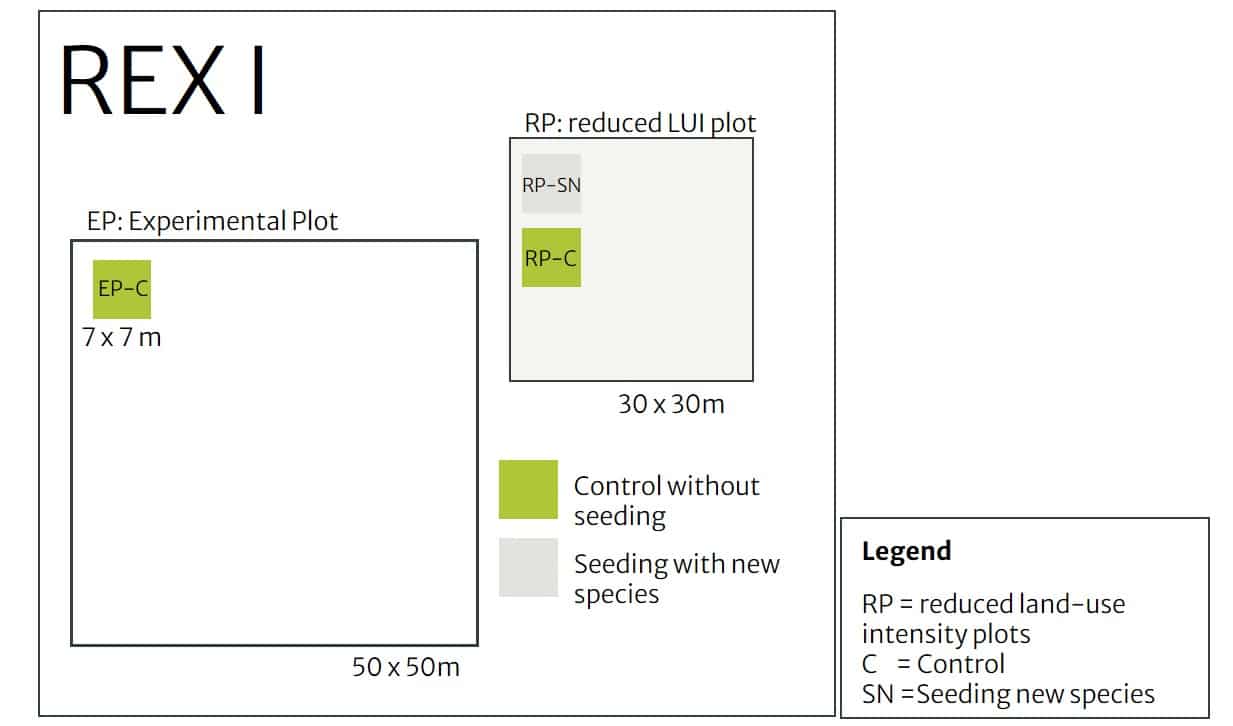
Design 1: REX I
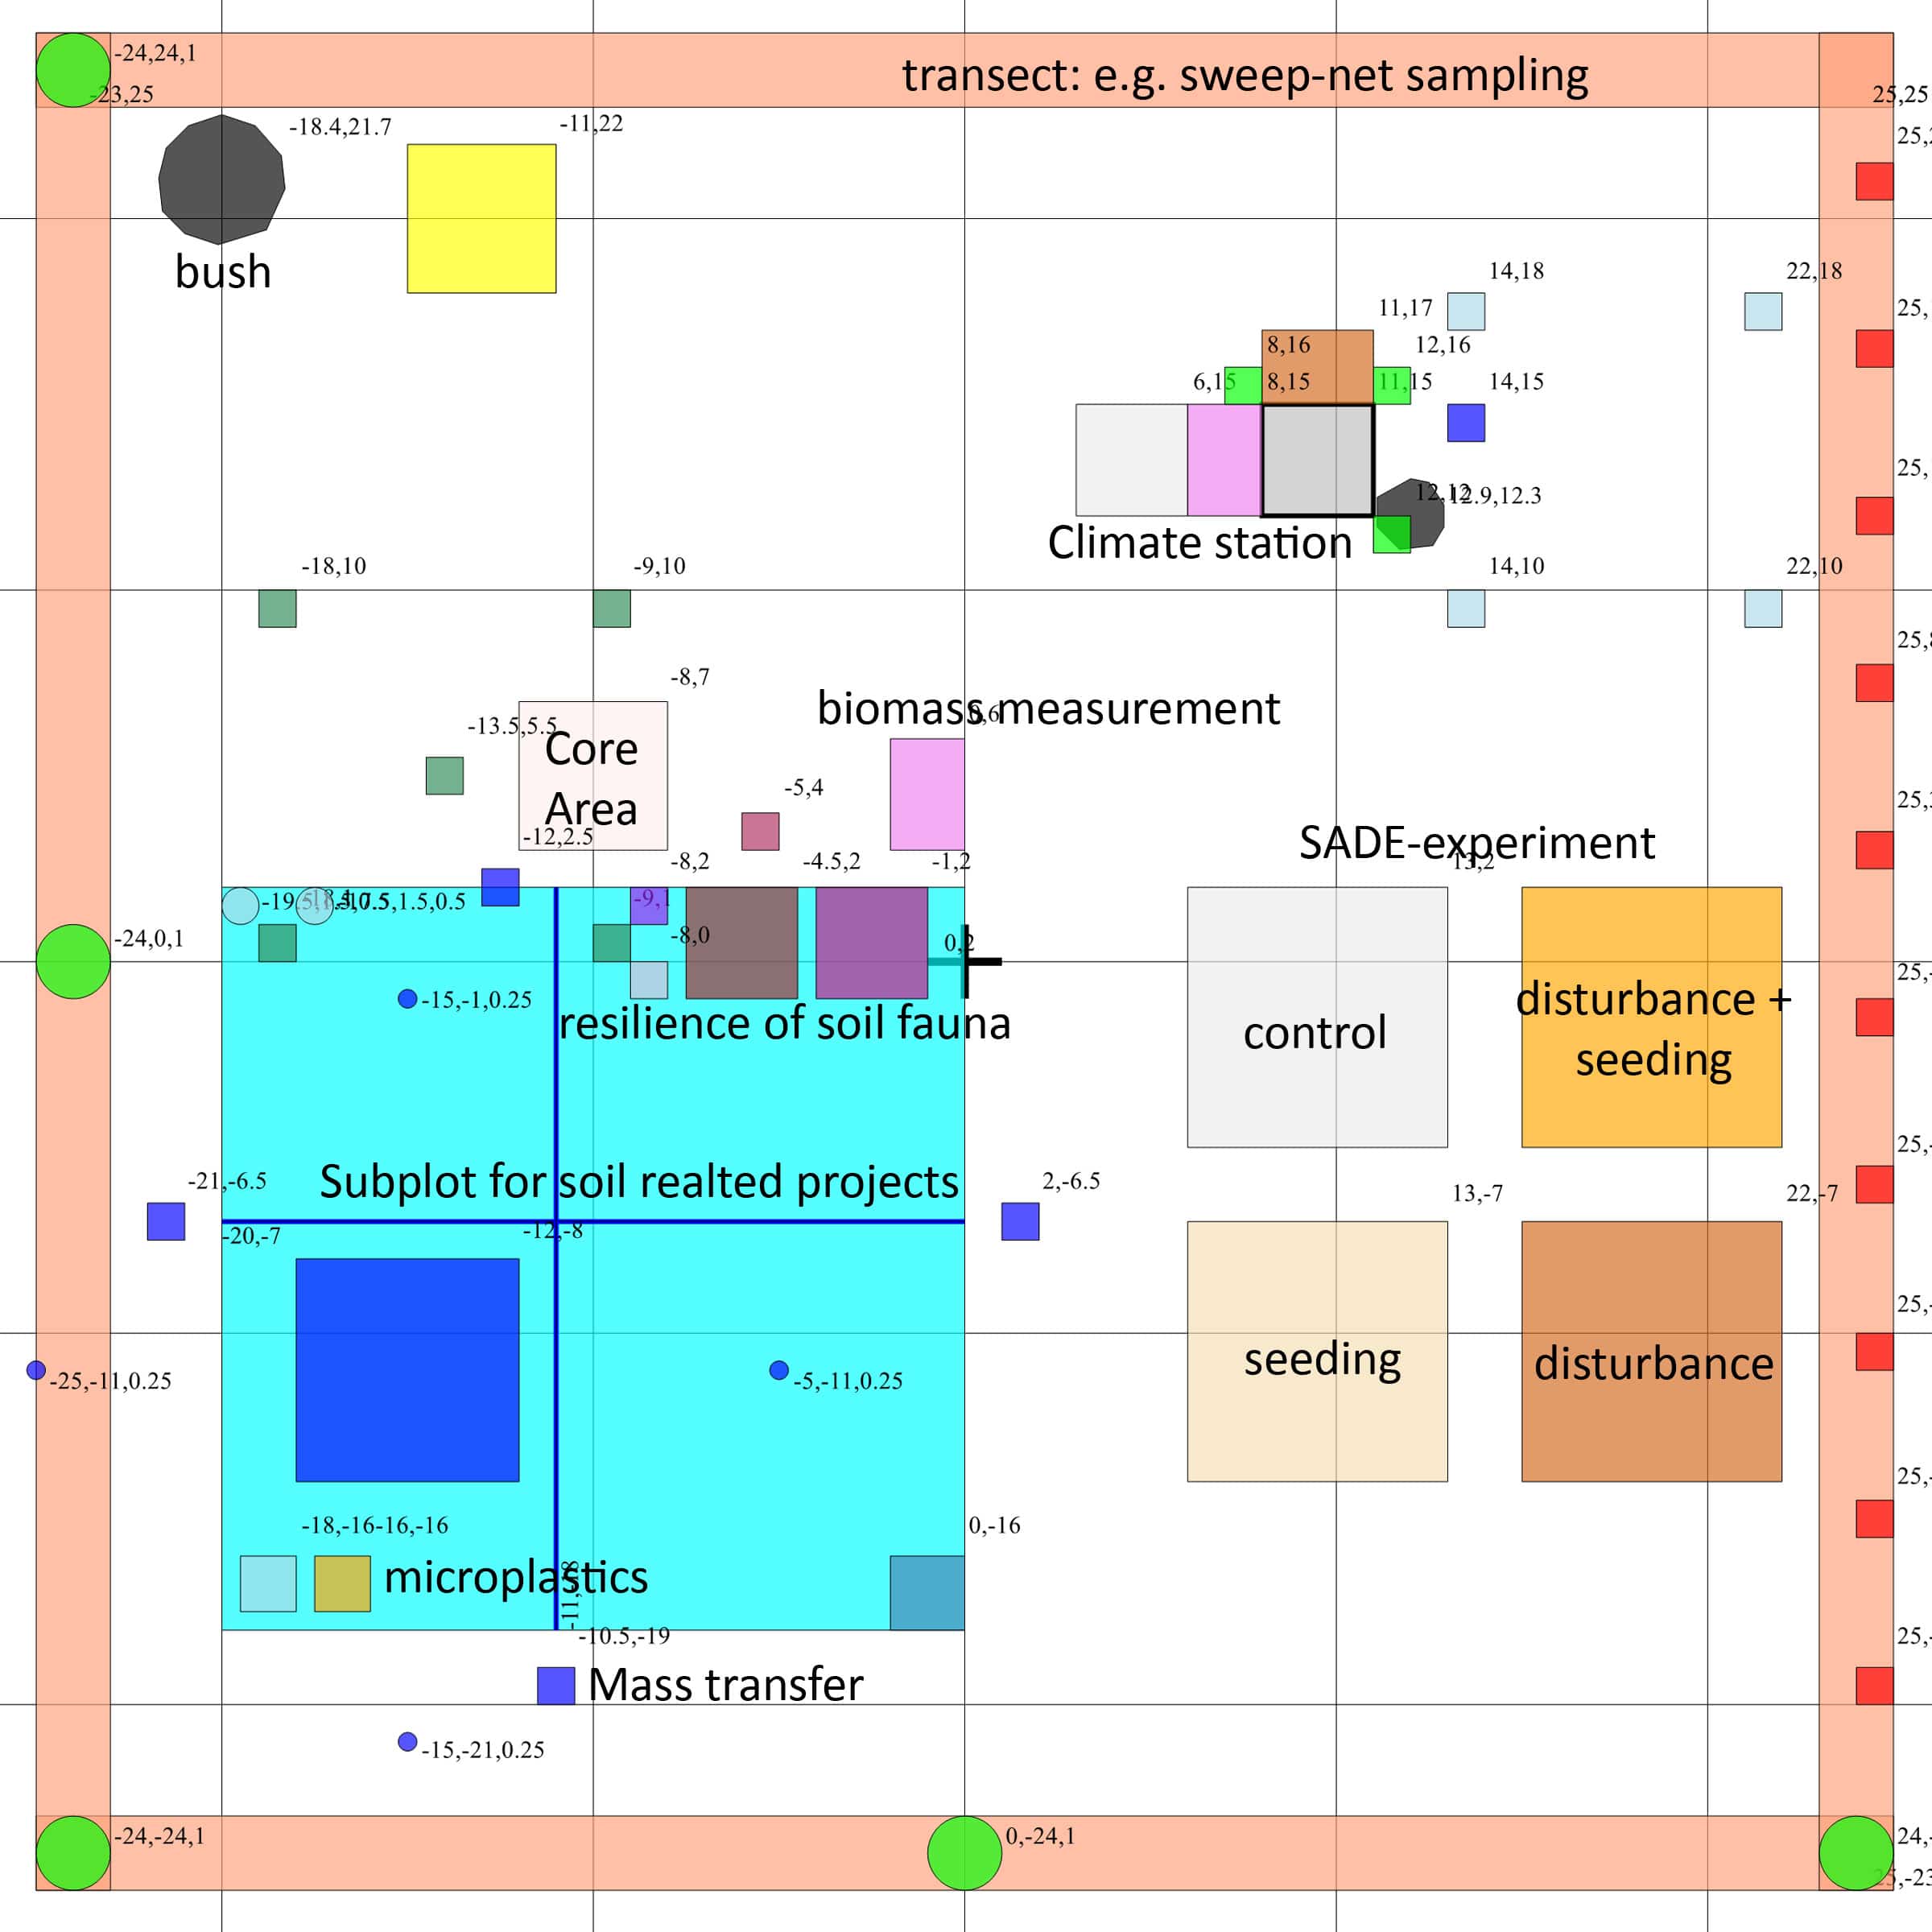
Additional plots of 30 x 30 m were marked on 15 grassland sites per exploratory (Totalling 45 sites), where land use is reduced to a minimum. This means that fertilisation is stopped and mowing is done only once a year – at the end of summer. These areas are called reduced land-use intensity plots (RP). Within each RP, a subplot of 7 x 7 m was marked for the sowing of additional species. In autumn 2019, the surface of this subplot was loosened and new species from the regional species pool, which had not previously been present on the plot, were sown (RP-SN, Fig. 2).
Design 2: REX II
Additional study plots were established on a subgroup of 16 of the 45 grassland sites from REX I (Fig. 3):
- In one subplot, species already present on the site (so-called resident species) were sown (RP-SR, Fig. 3). This is to test whether the introduction of seeds has an effect on productivity under both normal and reduced land-use intensity.
- In addition, it needs to be tested whether the sowing of new species also has an effect, if the land-use intensity is not reduced. For this purpose, an additional sown subplot was established on the EP (EP-SN, Fig. 3).
- Other subplots were also established, where the surface was scarified only, but where no sowing took place (RP-SC, Fig. 3). This is to check whether the soil surface treatment had an effect on diversity.
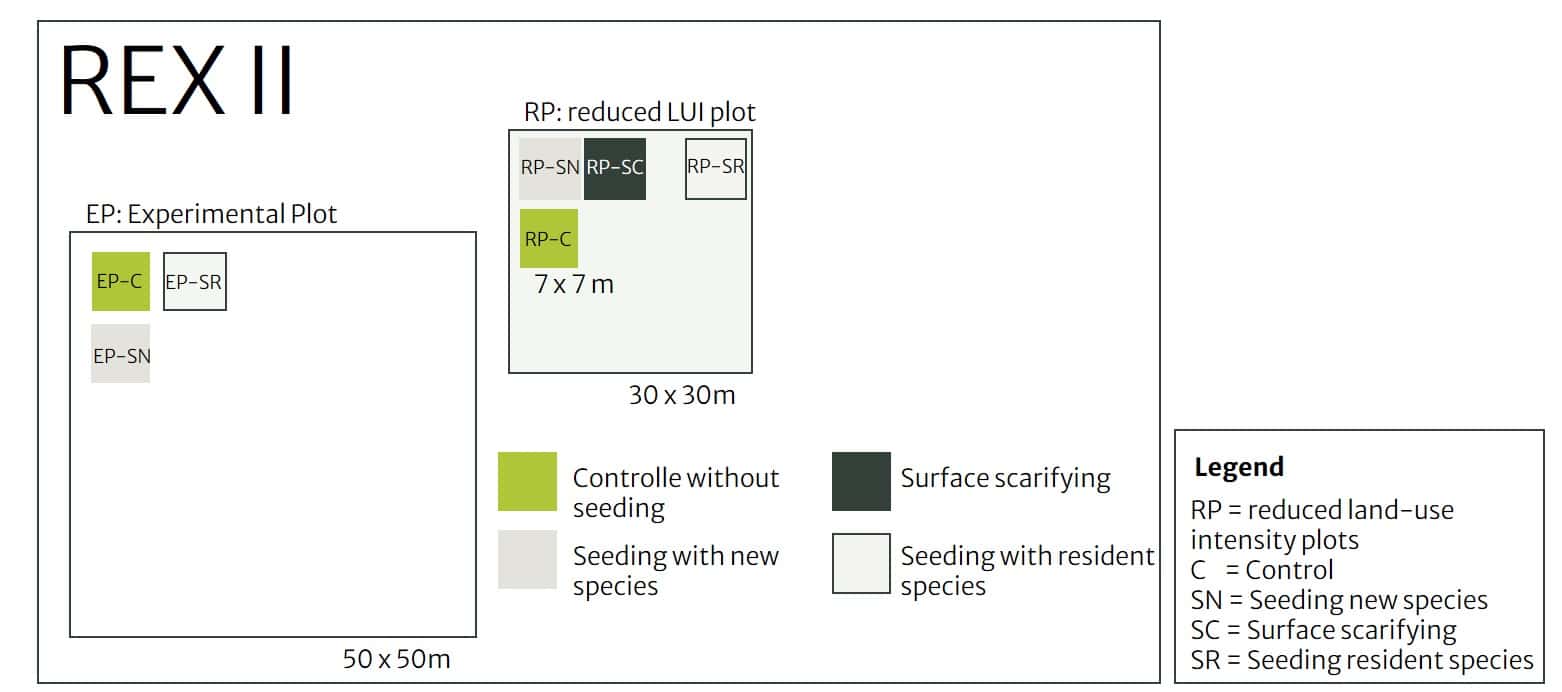
These additional treatments were carried out on a total of 16 sites (4 in the Schorfheide, 6 in the Alb and 6 in the Hainich) of the 45 selected grassland plots. These 16 sites are the same sites as in the land-use experiment (LUX).
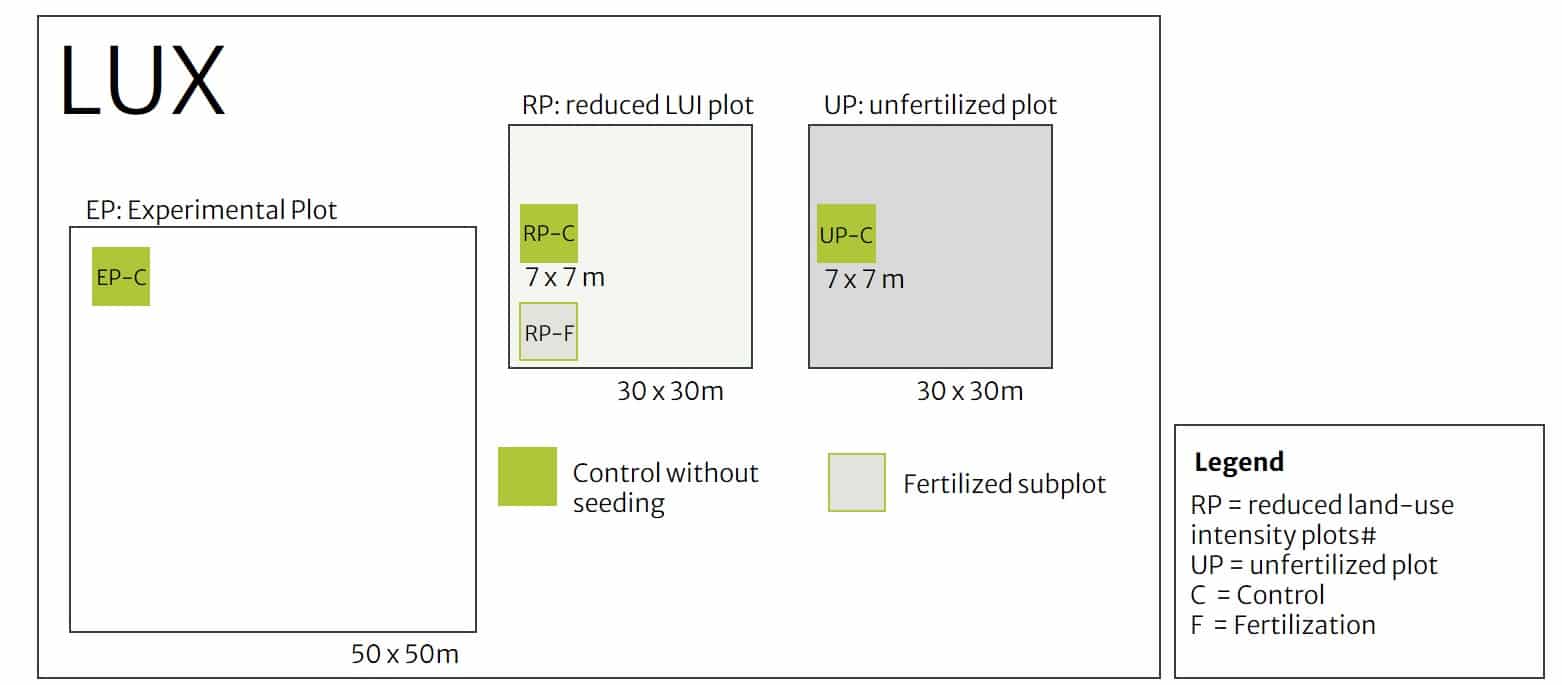
Land-use experiment (LUX)
The background to the establishment of these study plots is the question of how changes in land use (mowing, grazing and fertilisation) affect the diversity and functions of the ecosystem.
Design:
Additional plots of 30 x 30 m were established for the land-use experiment, on which fertilisation was discontinued in 2020. However, the other components of land use (mowing, grazing and other management measures) were continued as before. Thus, the only difference between this plot and the EP plot in terms of land use is the way fertilisation is handled. These new plots are called UP (unfertilised plots). For this experiment, we also created subplots of 7 x 7 m where fertilisation is done manually to factorially combine the land-use components ‘fertilisation’ and ‘mowing/grazing’ (RP-F, Fig. 4).
First results of the REX/LUX experiment:
Plants
- In the first two years, while biomass production was reduced, vegetation composition hardly changed yet where land-use intensity was reduced in the REX and LUX experiments. However, species abundances have started to respond, suggesting stronger changes in the future.
Arthropods
- Experimental reduction of land use (RPs) increases arthropod abundance, but not diversity
- Effects of reduction in land use are strongest in intensively-used grasslands with relatively more mowing and higher fertilization
- Effects of reduction in land use on arthropod abundance increase over time
Detailed information on the new grassland experiments (REX, LUX) is available for download here:
Forest gap experiment (FOX)
The background of this experiment is to analyse the effects of creating gaps with and without deadwood enrichment as targeted experimental interventions in 29 forests with different management, biodiversity and ecosystem functions. More specifically, the experiment aims to elucidate the effects of two important factors related to forest management:
- the change in abiotic conditions due to the opening of the canopy, and
- the availability of biotic resources as a function of logging.
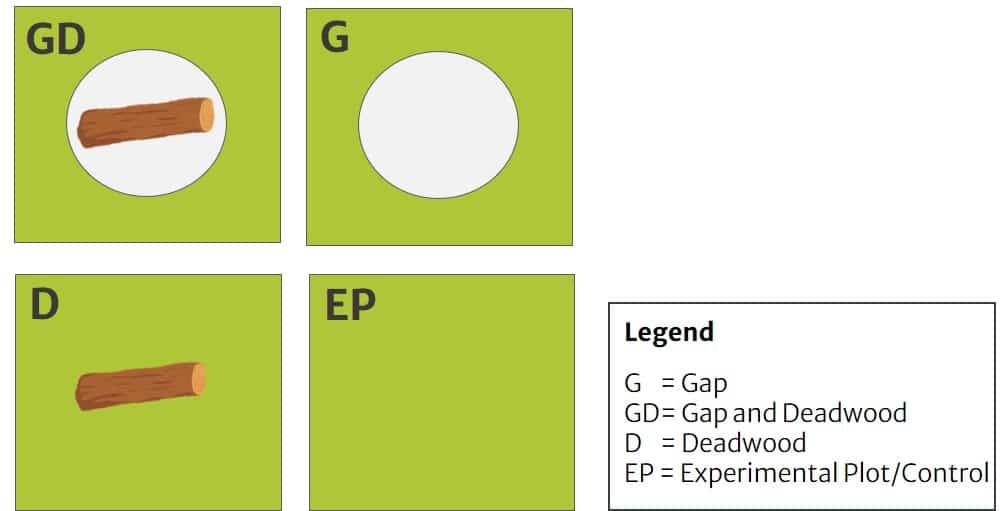
Design:
The experiment comprises four different variants (Fig. 5):
- Structure 1: Gap (G) i.e. creating a gap and removing all felled trees.
- Structure 2: Gap and deadwood (GD), i.e. creating a gap and leaving a certain amount of deadwood.
- Structure 3: Deadwood (D), i.e. no gap, but addition of a certain amount of deadwood.
- Design 0: Control, without additional deadwood and without crown opening. The plots are the regular experimental plots (EPs).
First results of the FOX experiment:
Plants:
- Plant diversity increased strongly in experimental gaps, and especially so towards the center of the gaps. So far, the deadwood treatment did not affect plant diversity.
Arthropods
- Forest gaps reduce the density and species number of oribatid mites.
- Deadwood addition to forest gaps does not mitigate detrimental effects of gaps on oribatid mites
- Open canopy treatments (Gap, Gap and deadwood) have more arthropod individuals and species and also higher arthropod diversity compared to closed canopy treatments (Deadwood, Control)
- The increase in species richness and diversity is primarily driven by the higher number of individuals
- Community composition differs between open and closed canopy treatments
- For Hemiptera, gaps primarily are inhabited by open land and not forest associated species
- Ecological processes related to arthropods are also affected by the creation of gaps, with dung removal being lower in open than in closed treatments, which is mediated by lower dung beetle biomass in the open
Microbes
- No clear effect of the treatments on soil microbial activity and decomposition after one year of gap formation
More information on the selection and design of FOX can be found in the PDF here: