Land-use effects on plant and microbe communities: An experimental common garden approach
Changes in land-use intensity along with land degradation have been identified as major causes of the decline in biodiversity and a loss of ecological functions. The application of fertiliser, mowing and grazing are land-use components that have been shown to affect plant species diversity and composition in grasslands in many ways. However, a strong environmental impact on the effects of land use can be inferred by the variation in strength as well as direction of these effects. Site-specific differences in regard to various environmental factors between but also within the three Exploratories impede a separation of environmental and land-use effects and therefore the identification of the actual effects of land use on communities. Thus, we establish a controlled environment by using a common-garden approach to better illustrate the sole effects of various types of land use by reducing environmental heterogeneity to a minimum.
- Communities originating from different plots but treated in the same way will converge on composition and diversity, whereas communities originating from the same plot but subjected to different treatments will diverge.
- Strength in response to land-use treatments by plant and bacteria communities is proportional to the difference in the land-use intensity in the original sites (Biodiversity Exploratories) and in the treatments.
- Sod parts originating from plots with a more variable land-use history will diverge less than sod parts originating from plots with a more stable past.
- Responses of bacterial communities on land-use treatments are faster than responses of plant communities.
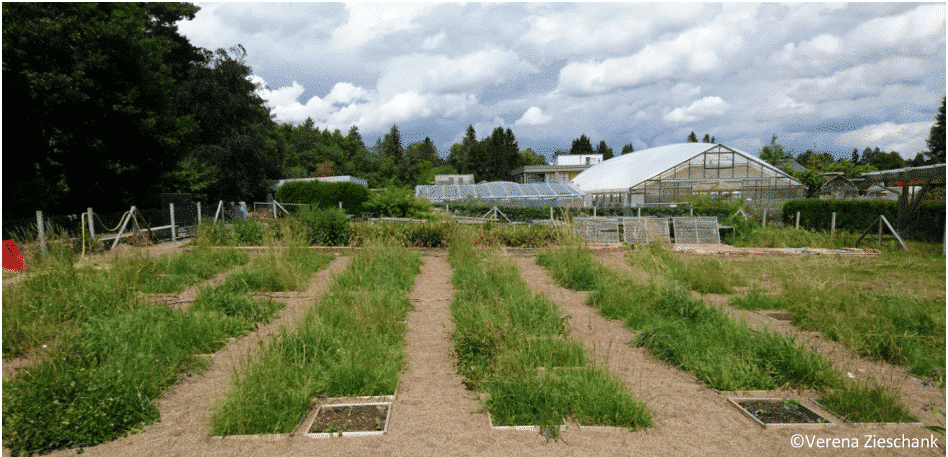
Establishment of the common garden and implementation of different land-use treatments
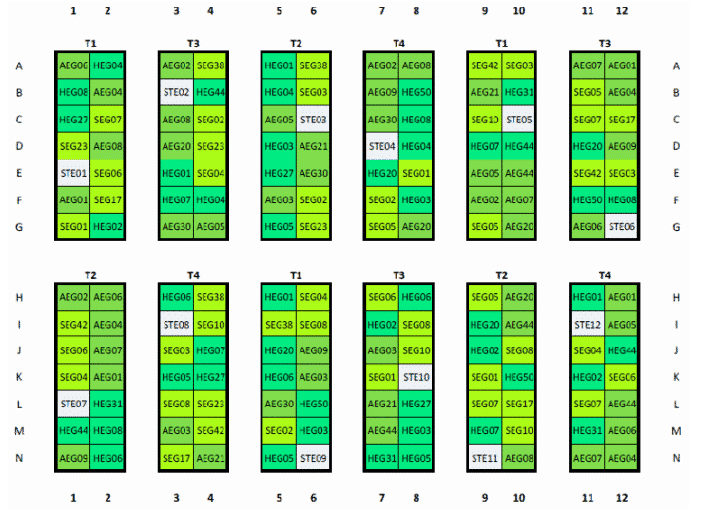
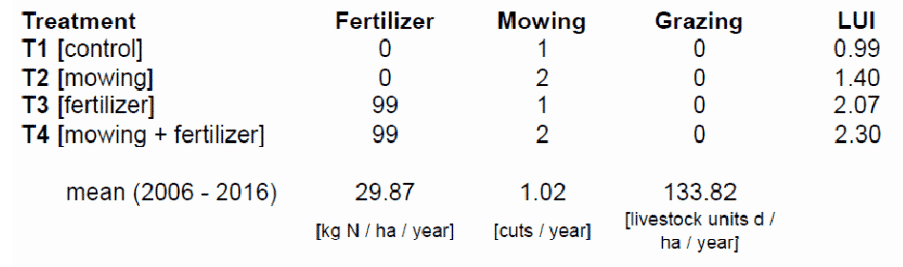
Grass sods (1x1m) harvested at n = 39 plots of the Biodiversity Exploratories have been partitioned into four equal parts. Each of the subplots (50x50cm) will be subjected to one of the four land-use treatments (Tab. 1). Additionally, one plot containing sterilised soil has been placed in each treatment block.
Recording of plant and bacterial communities
Directly after the establishment of the common garden but prior to the application of treatments the plant’s species, functional composition and diversity as well as the bacterial communities (next-generation 16SrRNA gene amplicon sequencing), will be assessed. In 2021 and 2022, the plant’s species and functional composition and diversity will be reassessed. The plant traits that will be considered are plant height, leaf area, leaf dry-weight and specific leaf area (SLA). Bacterial communities will be recorded again as well. Changes in the plant and bacterial composition and diversity will be related to the land-use history of each of the plots.
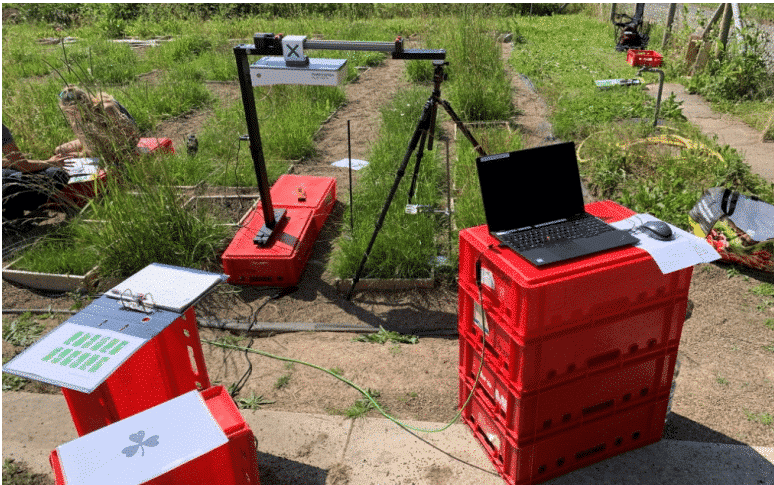
Phenotyping of plant communities using PlantEye500 (Phenospex)
Aside from the ‘classical’ methods of data collection, all plots will be scanned using the PlantEye.
Public Datasets
Scientific assistants