Instrumentation and Remote Sensing
Core Project 3 – The so-called Core Projects of the Biodiversity Exploratories (BE) emerged from the on-site project selection and the establishment of the exploratories (2006-2008), and have been providing the infrastructure since 2008.
Systematic and continuous recording of environmental data is an important element of the research infrastructure in the Biodiversity Exploratories.
Core Project 3 “Instrumentation and Remote Sensing” is responsible for (i) systematic and large-area measurement and recording of meteorological and soil environmental variables and (ii) provision of remote sensing data and geospatial data on land cover and land use.
For this purpose, Core Project 3 develops and operates an important research infrastructure consisting of a large network of climate stations, climate towers and remote sensing platforms and sensors. It regularly collects climatic and remote sensing data according to standardized procedures to produce coherent time series. These are made available via special database applications being developed in the project.
Instrumentation has therefore been a key component of the research infrastructure since the beginning of the Biodiversity Exploratories. Due to strong demand for remote sensing and geospatial data services, the remote sensing component was added to the project in 2014. This allows the establishment of an archive of geospatial data and remote sensing products accessible to all research groups, and coordination of new data acquisitions with satellites, aircrafts and drones. The services offered by Core Project 3 contribute to standardize and harmonize geodata in the Biodiversity Exploratories.
The goal of the core project is to establish and support the measurement and sensor technology and to provide environmental data as processed basic products (“ready to be used be the Exploratories’ researchers”) to address a wide range of research questions in the Biodiversity Exploratories. These data sets include:
- Climate variables: Climate monitoring stations on grassland and forest stations, TreeTalker on forest experiments (FOX), climate towers for vertical profiles.
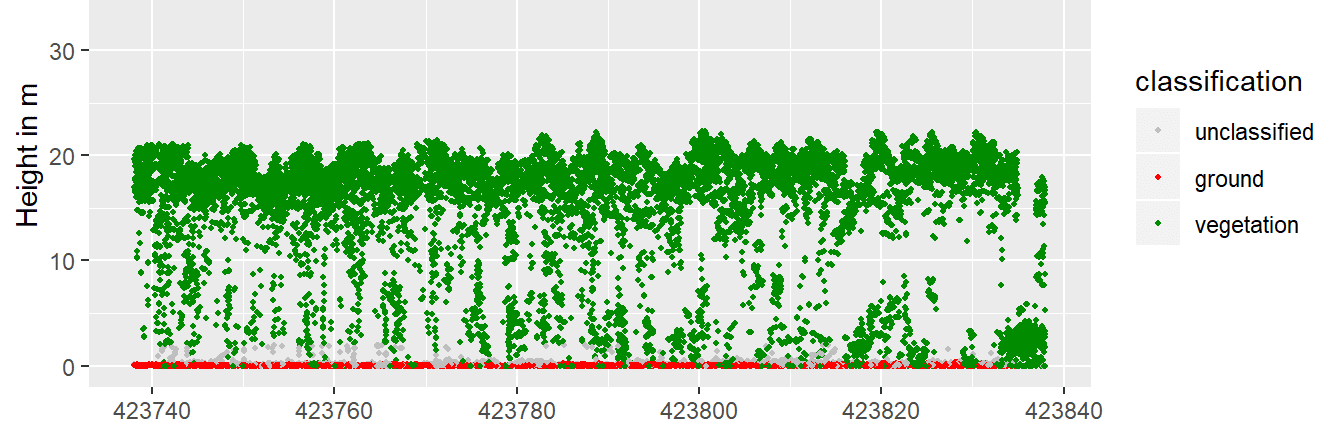
- Vegetation structure variables: Indices of vegetation spatial structure from laser scanning and photogrammetric point clouds.
- Audio environment: (ultrasound) recordings
- Provision and processing of land use and land cover maps
- Landscape structure: recording and quantification of landscape structure
- Coordination and execution of drone surveys
- Processing of Copernicus and Landsat satellite data to produce continuous time series and derived products (productivity, land use intensity, change analysis)
In addition to these products, the core project would like to foster the use of climate and geodata in biodiversity research. To this end, the core project offers workshops on the evaluation and use of climate and geodata.
Environmental measurement equipment
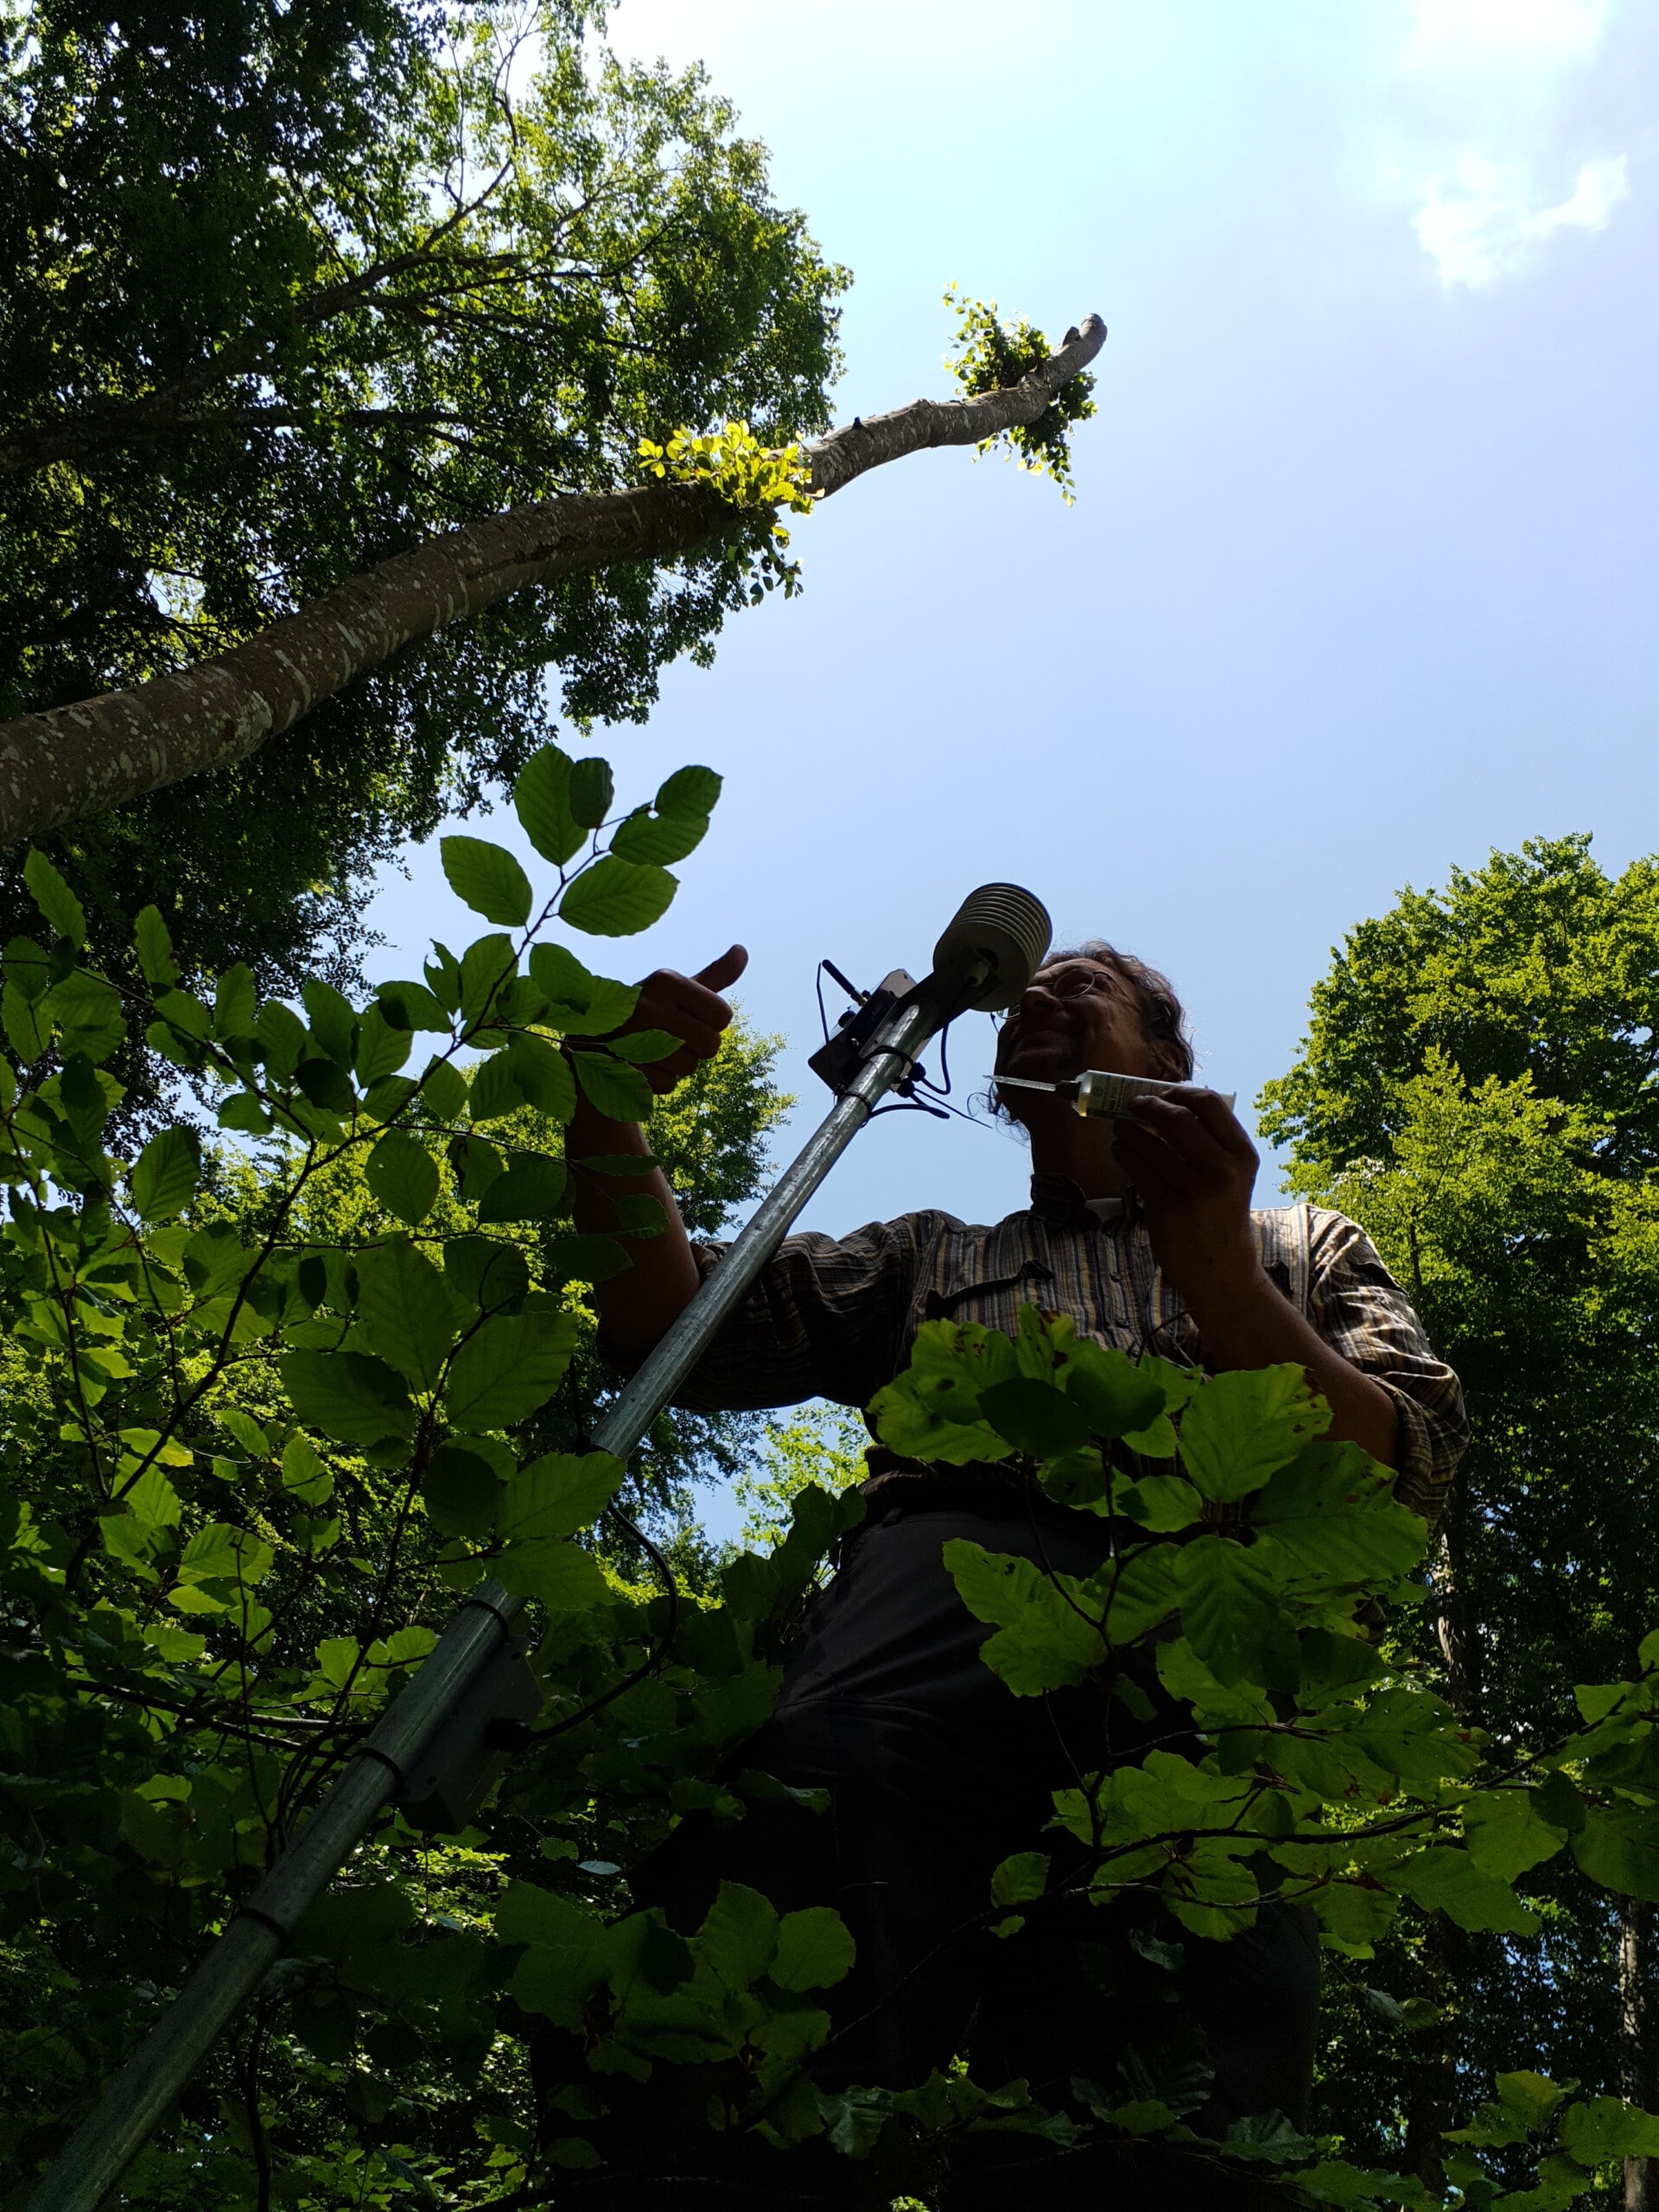
Meteorological and soil variables are among the main factors influencing the organismic diversity and functionality of ecosystem cycles. In order to carry out systematic and large-areameasurement and recording of these environmental variables, more than 400 permanent measuring devices are installed and maintained in the three exploratories Schorfheide-Chorin, Hainich-Dün and on the Swabian Alb.
Climate stations
In each exploratory, >140 measuring stations were set up, of which 50 each were installed in grassland and 91-111 each in the respective forest areas. Due to the very large number of stations, not all of them were equipped identically, but with graded sensor groups. Currently, the following station types are in use:
- 279 Core Environmental Monitoring Units (CEMU)
- 21 Enhanced Environmental Monitoring Stations (EEMU)
- 148 Fox Environmental Monitoring Units (FEMU) a la Treetalker
Type CEMU is used on all experimental sample plots (EPs) of the exploratories in the forest areas and grassland. In addition to general meteorological variables such as air temperature, surface temperature, and relative humidity, measurements are also taken in the soil. Five probes are deployed in the topsoil to continuously record soil temperature and moisture.
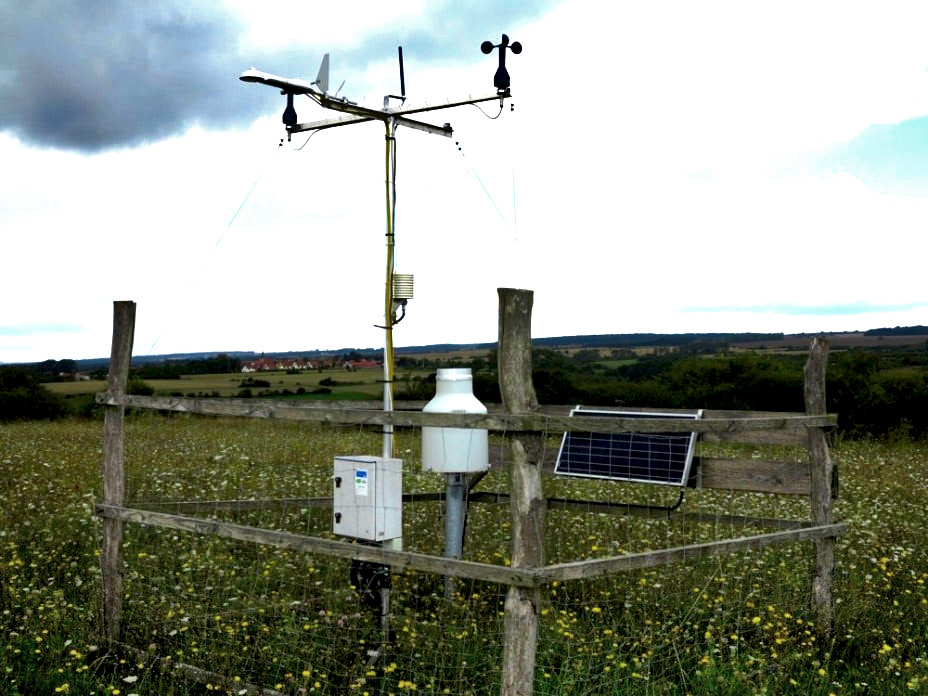
Type EEMU is deployed on selected intensive sample plots (VIPs) and topographically important sample areas, and also has complementary sensor technology to measure precipitation, wind speed and direction, incoming and outgoing radiation components of shortwave and long-wave radiation, photosynthetically active radiation (PAR), and atmospheric pressure.
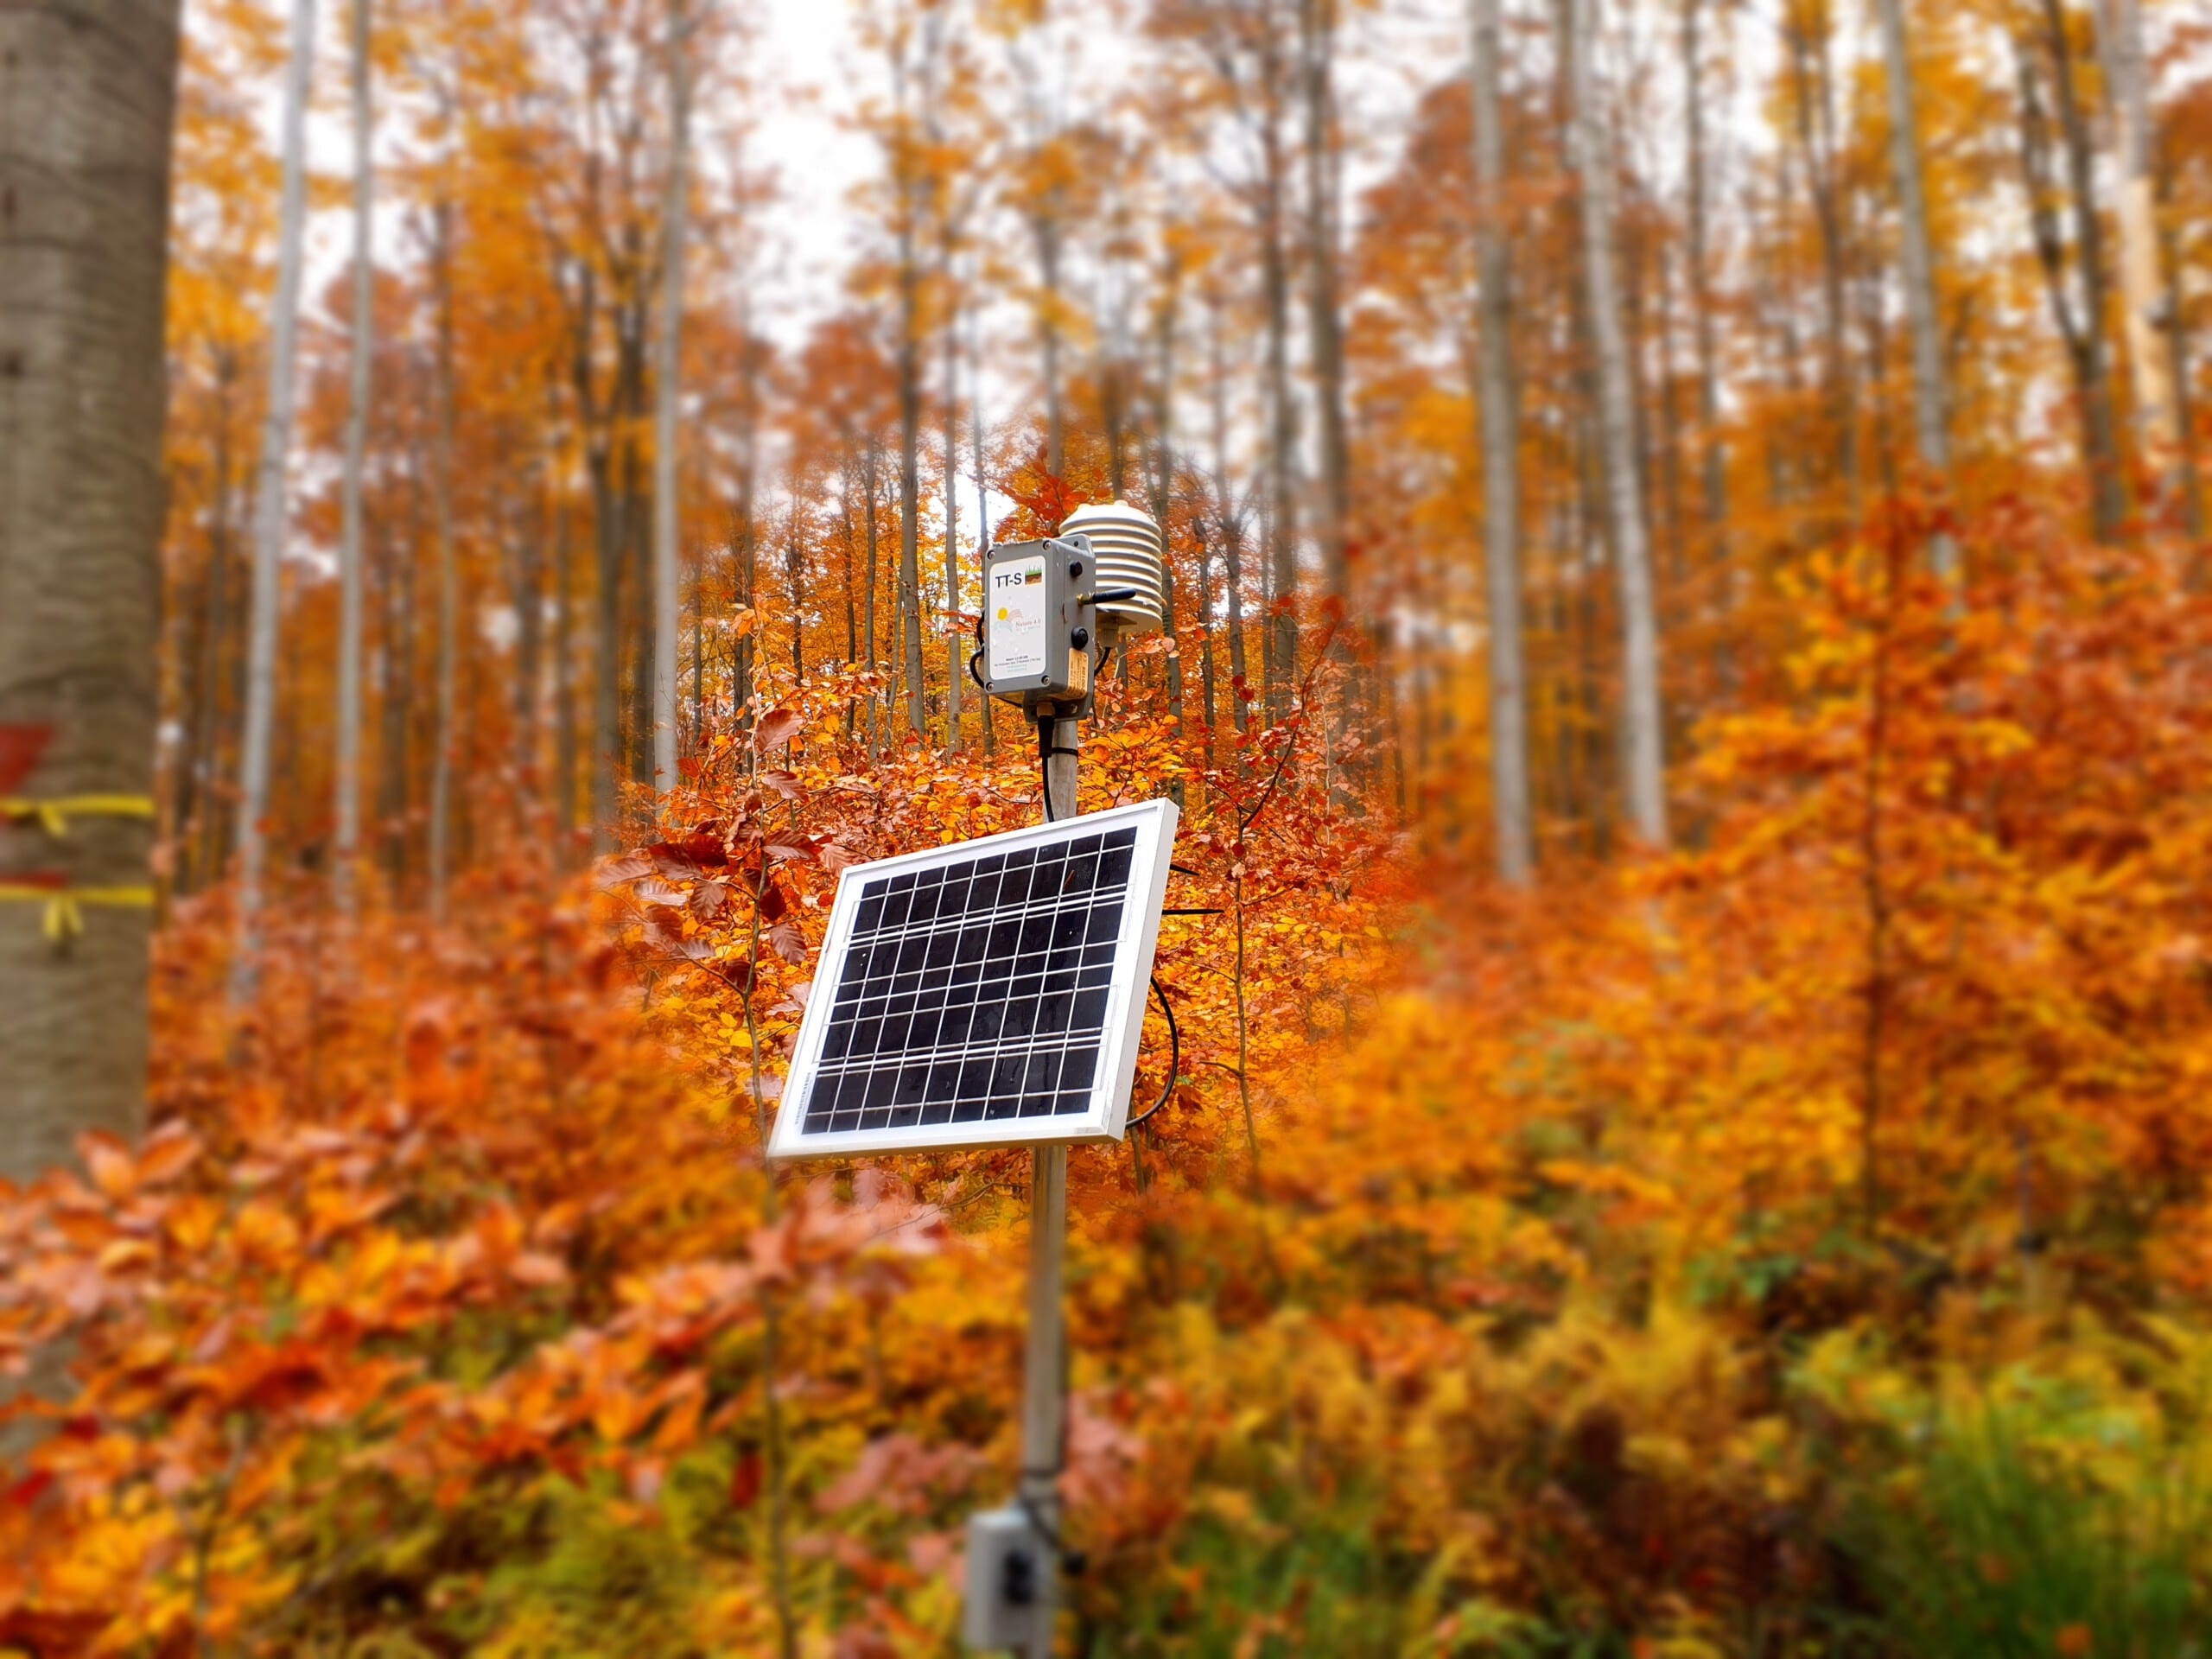
Type FEMU/ Treetalker is used on the forest experiment plots (FOX). In addition to general meteorological data such as air temperature and humidity, soil moisture and temperature measurements are also taken in the soil and solar radiation is recorded under the canopy in 12 spectral bands (450 – 860nm).
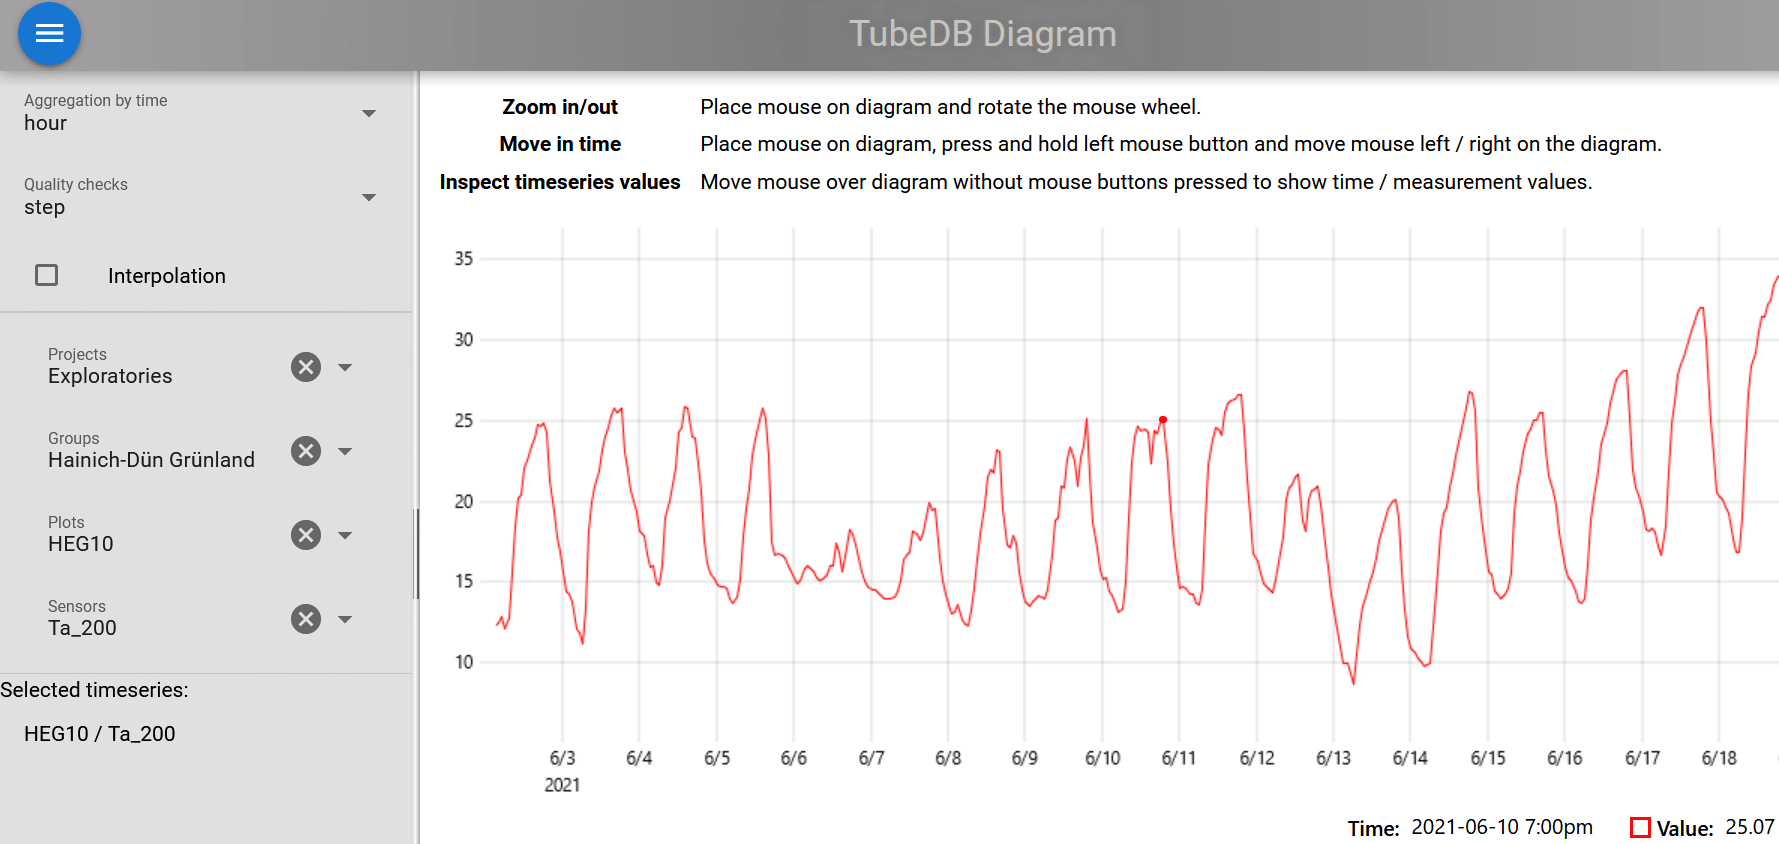
A visualization of the measured temperature time series can be seen here:
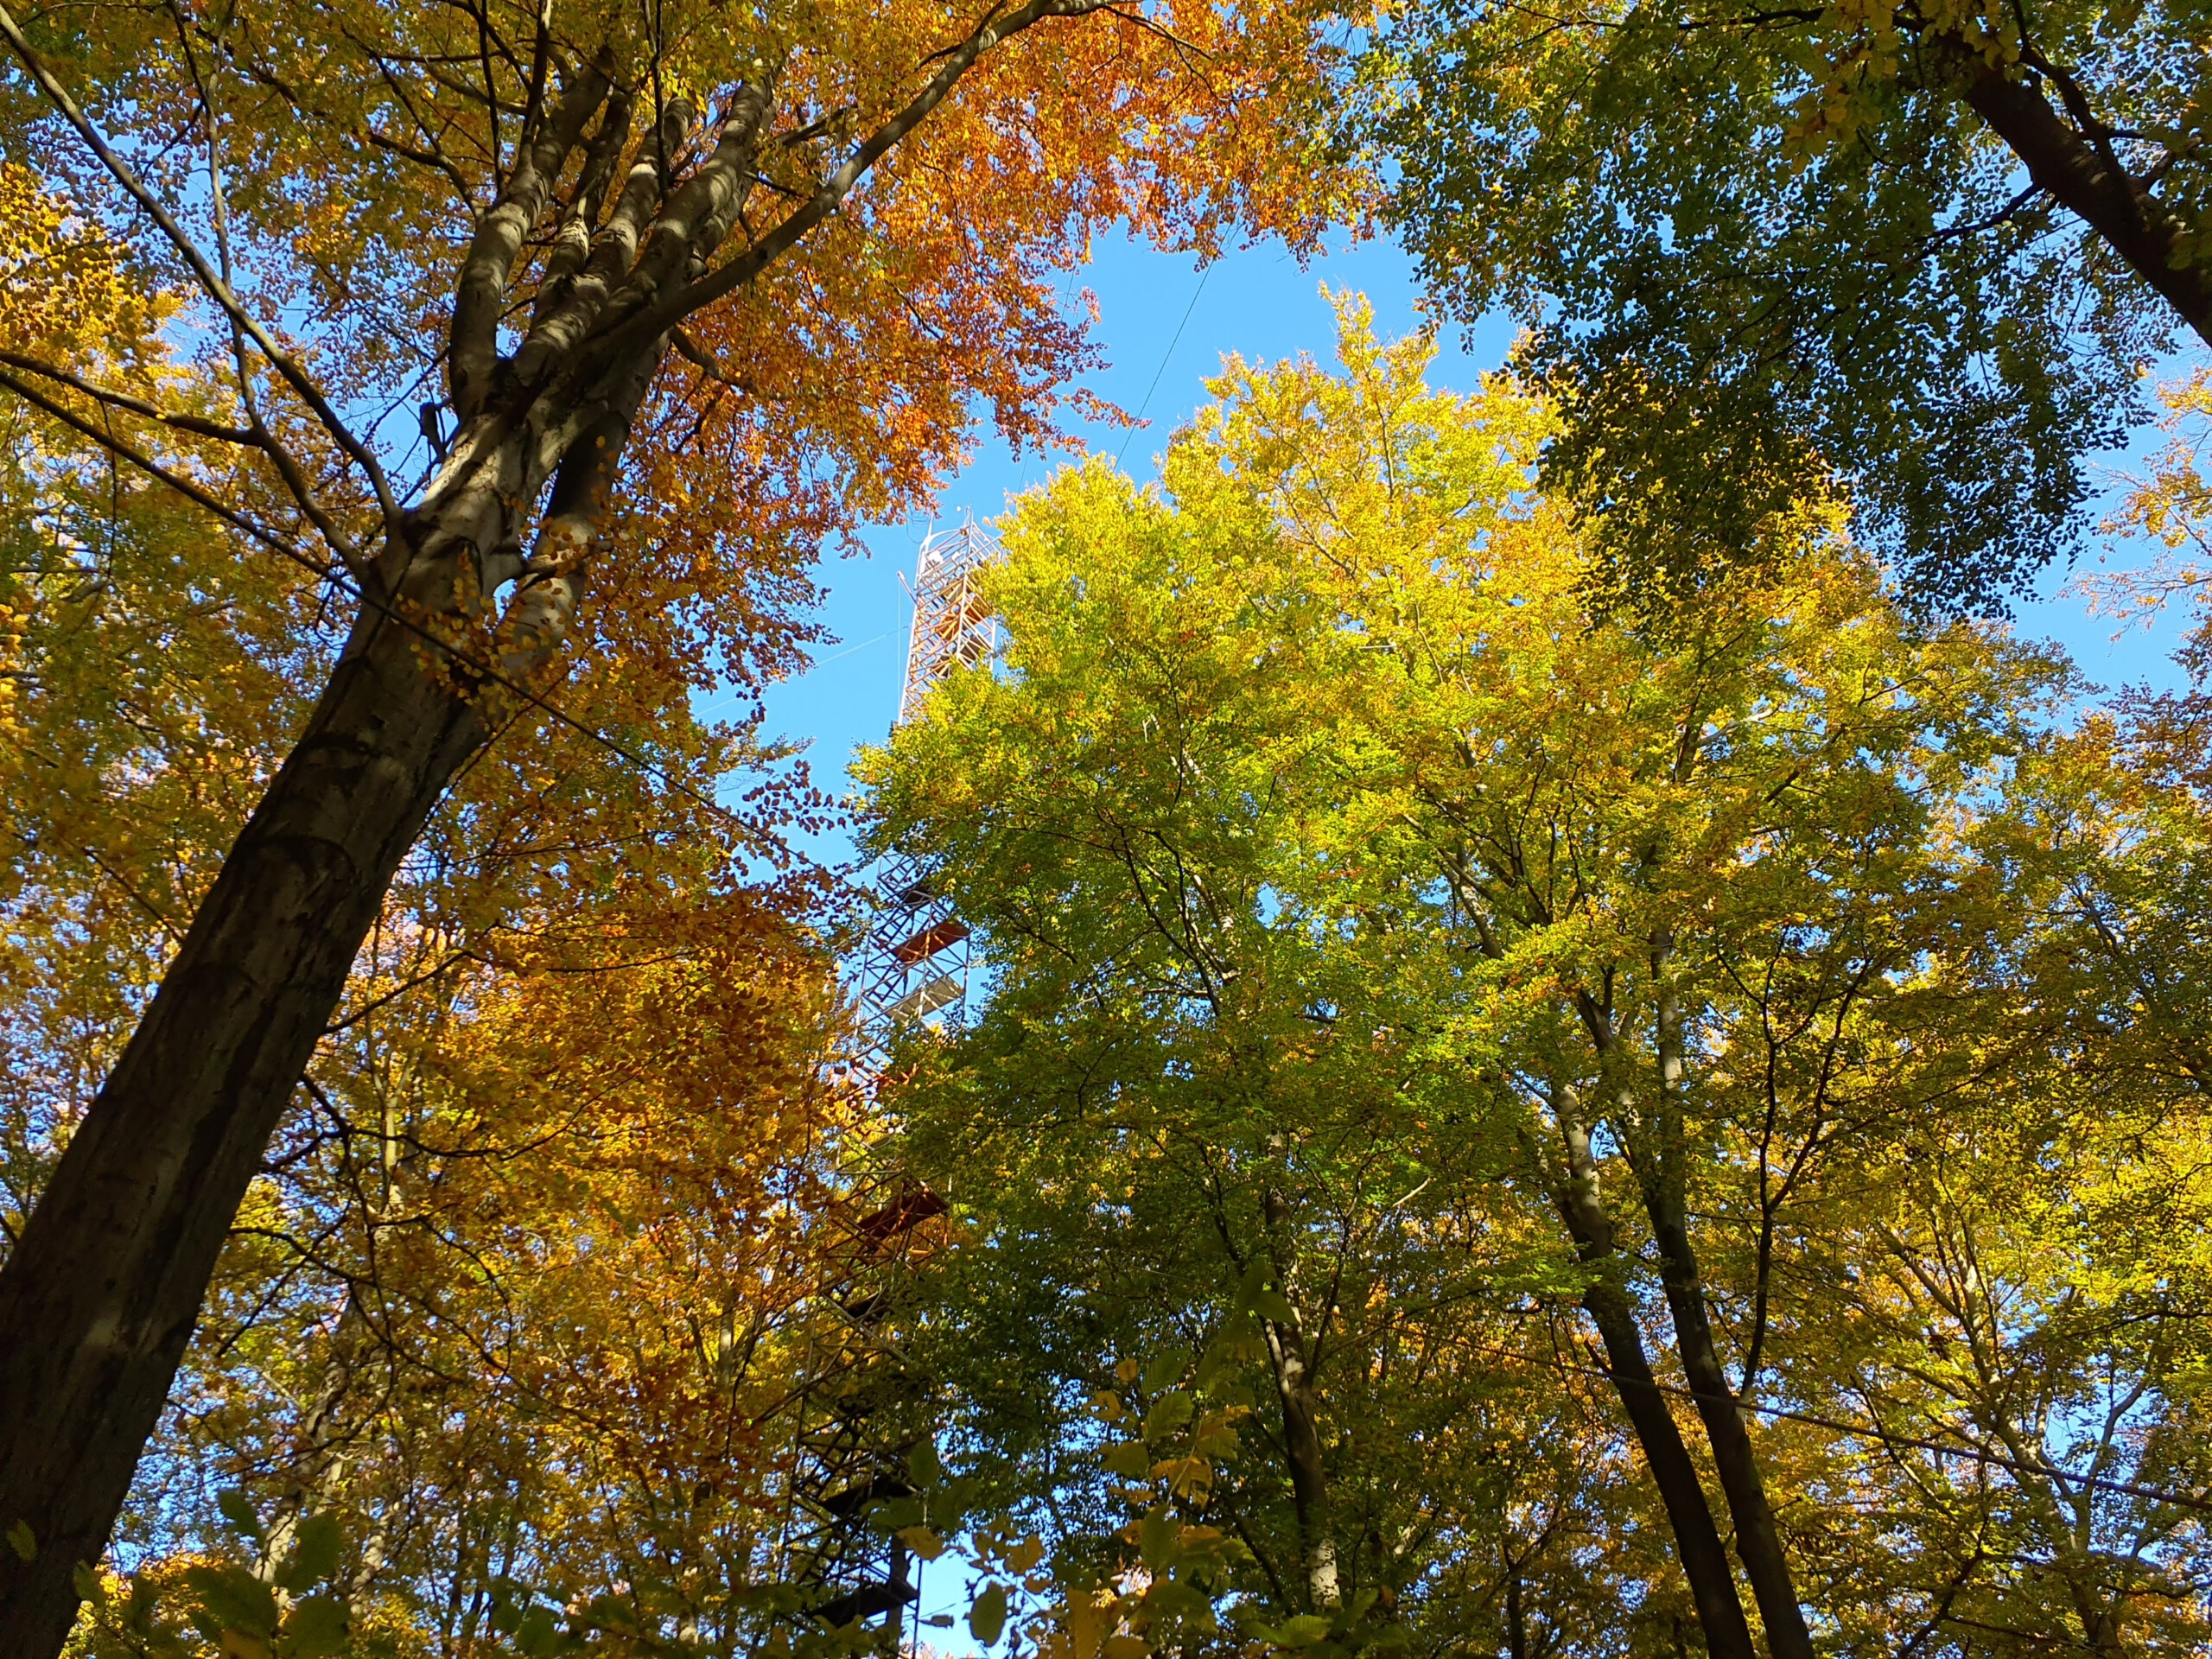
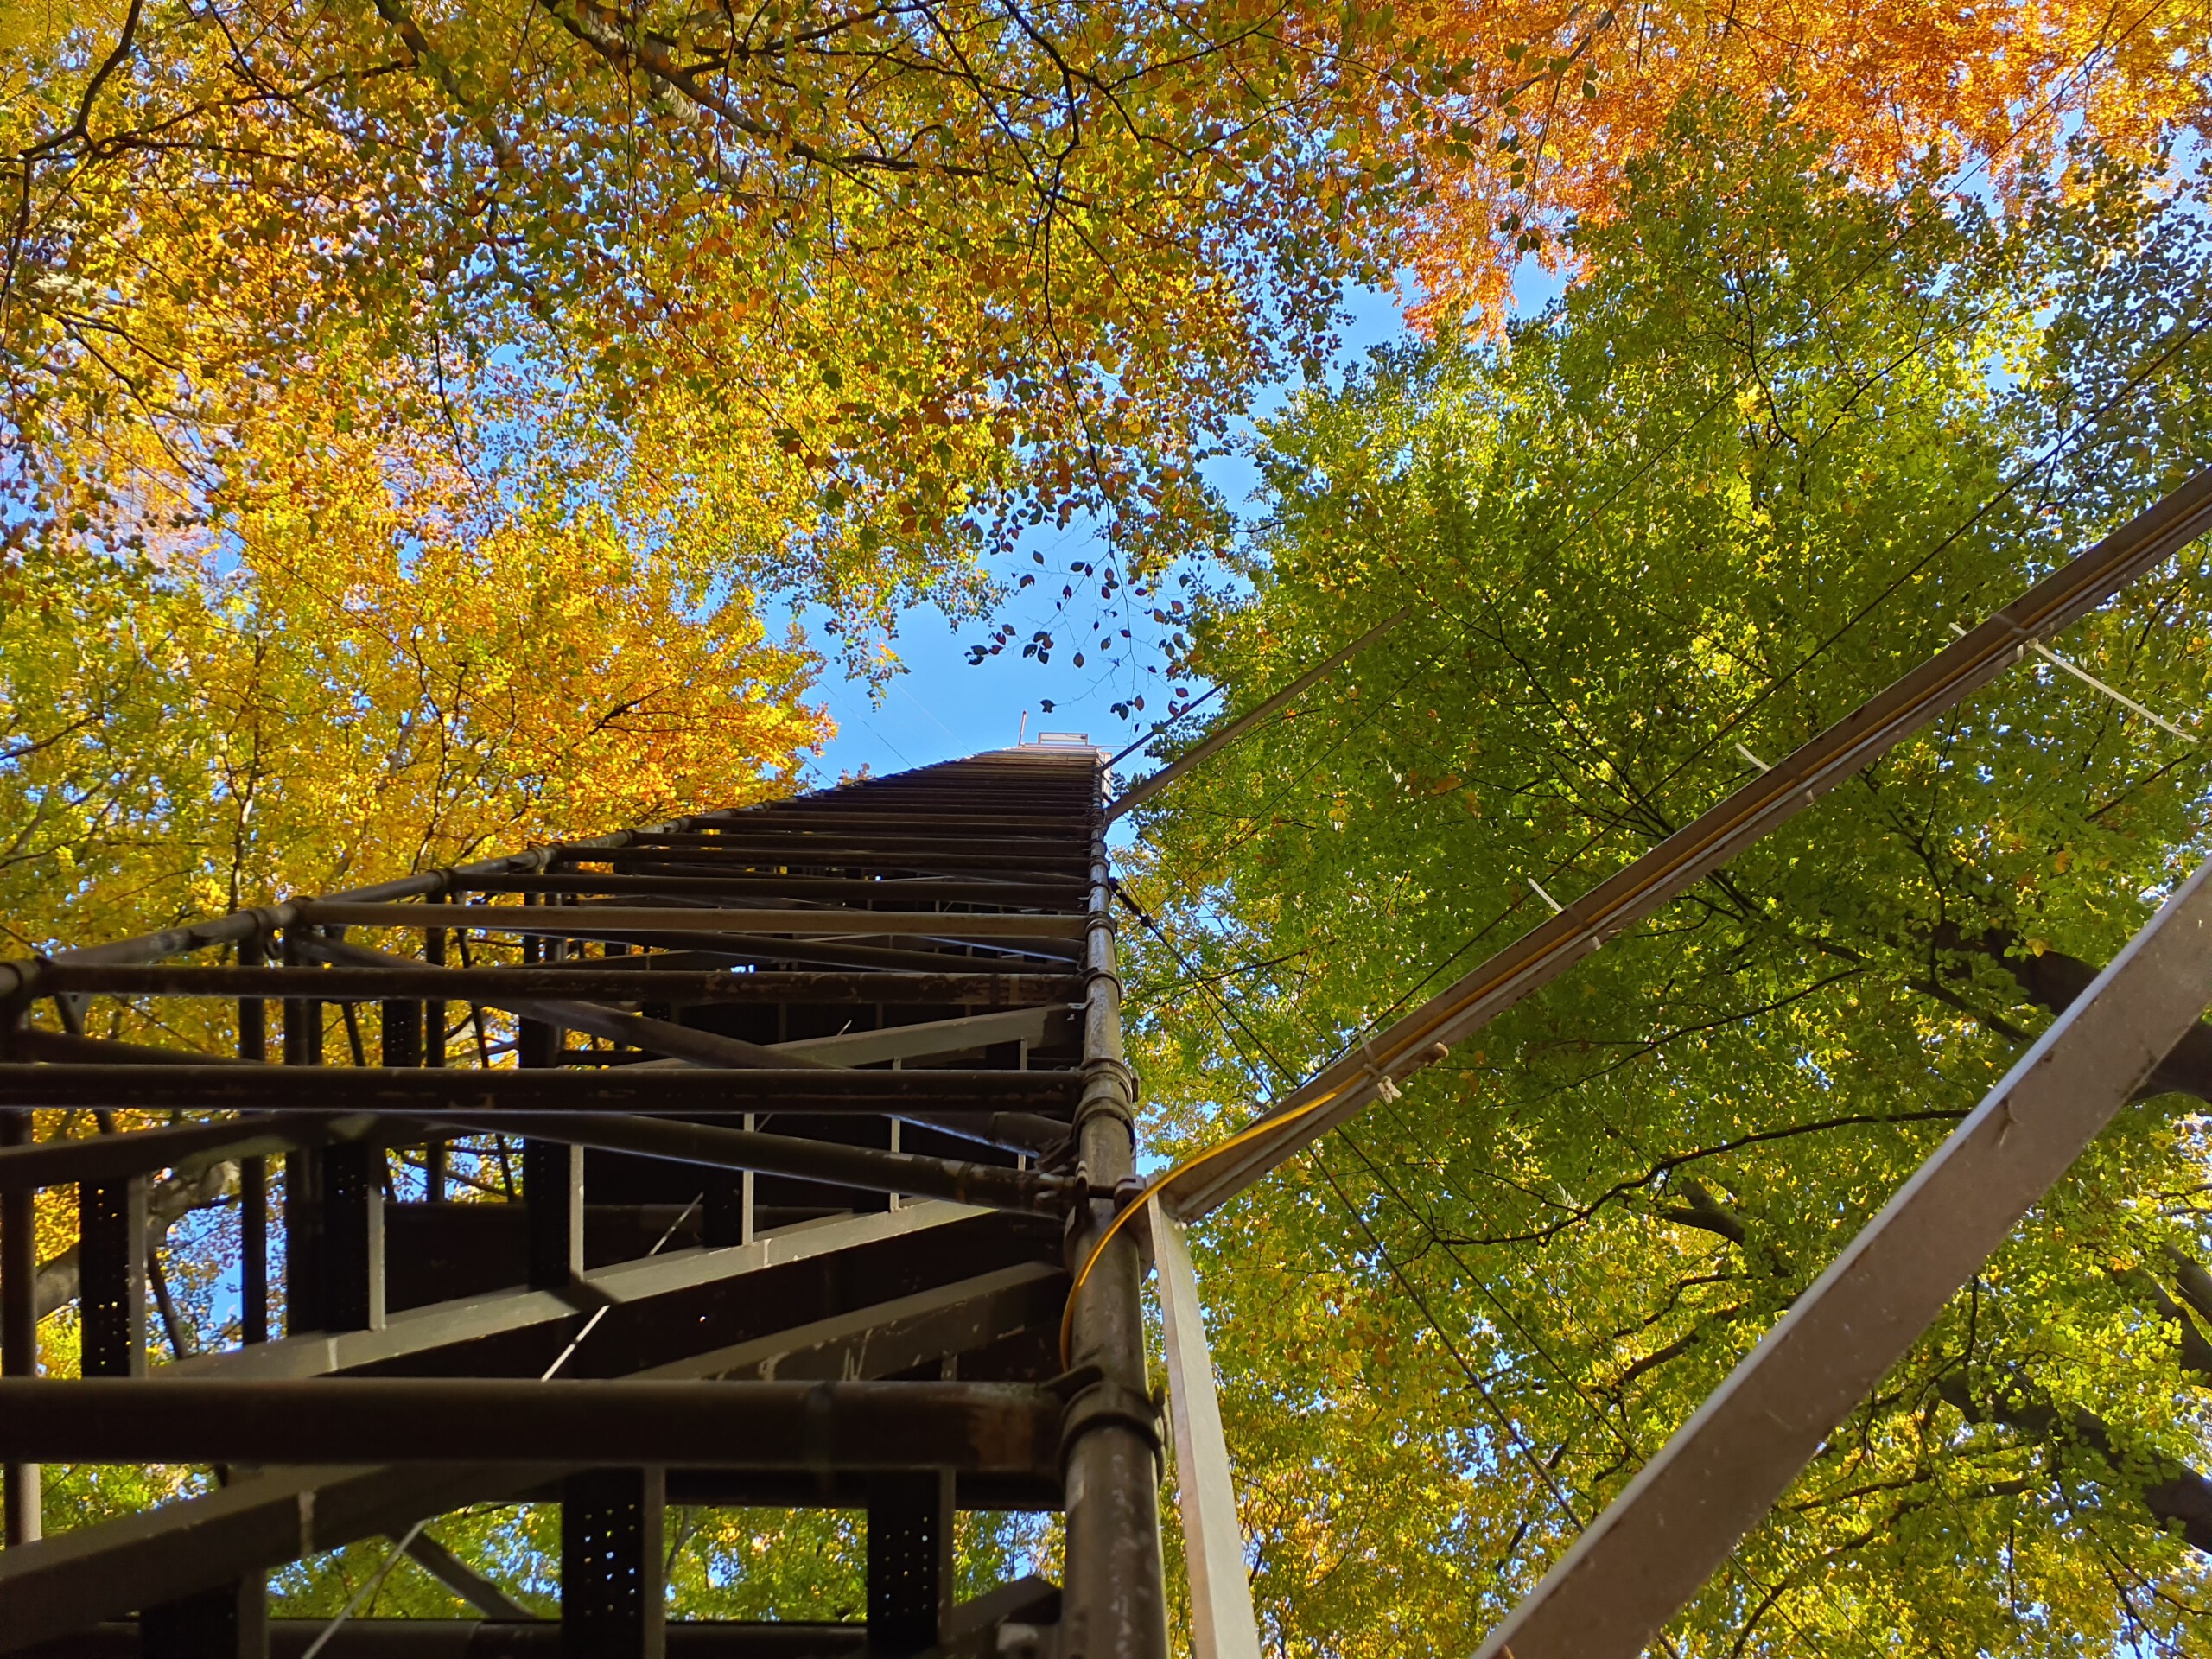
Climate towers
In the biosphere reserve Schorfheide-Chorin and on the Swabian Alb, a measurement tower with a height of 44 m and 37 m, respectively, was installed. Both towers include the sensor technology of the EEMUs and additionally measure the air temperature, air humidity and the PAR in the profile. Two further towers, which were built by the Max Planck Institute for Biogeochemistry, can also be used in the Hainich-Dün National Park.
Audio recordings
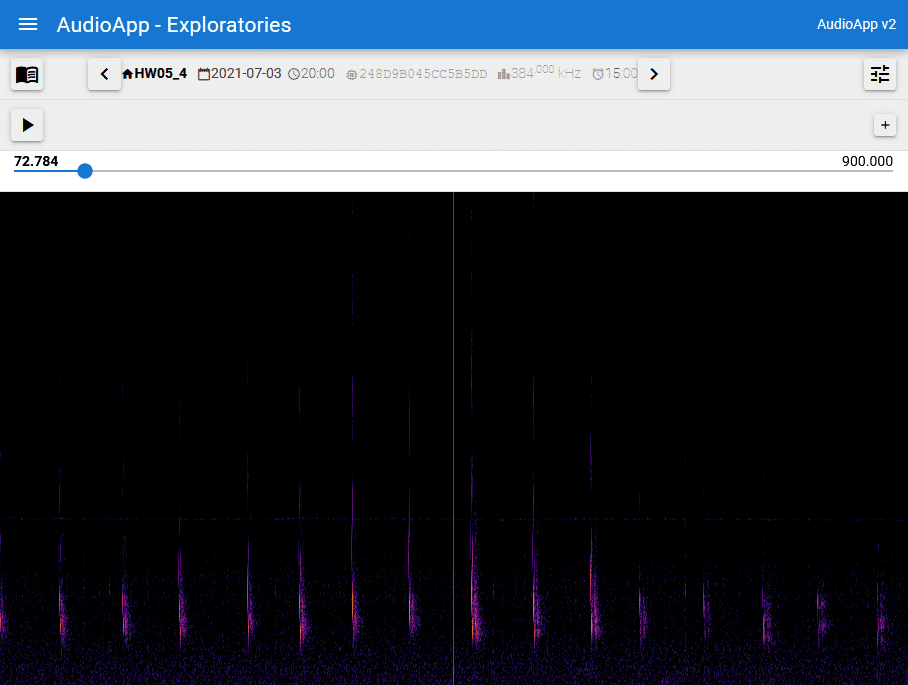
On selected plots, audio recorders capture soundscape in both audible and ultrasonic frequencies. Estimates of the occurrence and intensity of activity of birds, bats, and auditory ecosystem disturbances are recorded semi regularly. This provides the opportunity to systematically and simultaneously record and analyze differences in occurrence and activity between seasons and plots.
Remote sensing & geo data
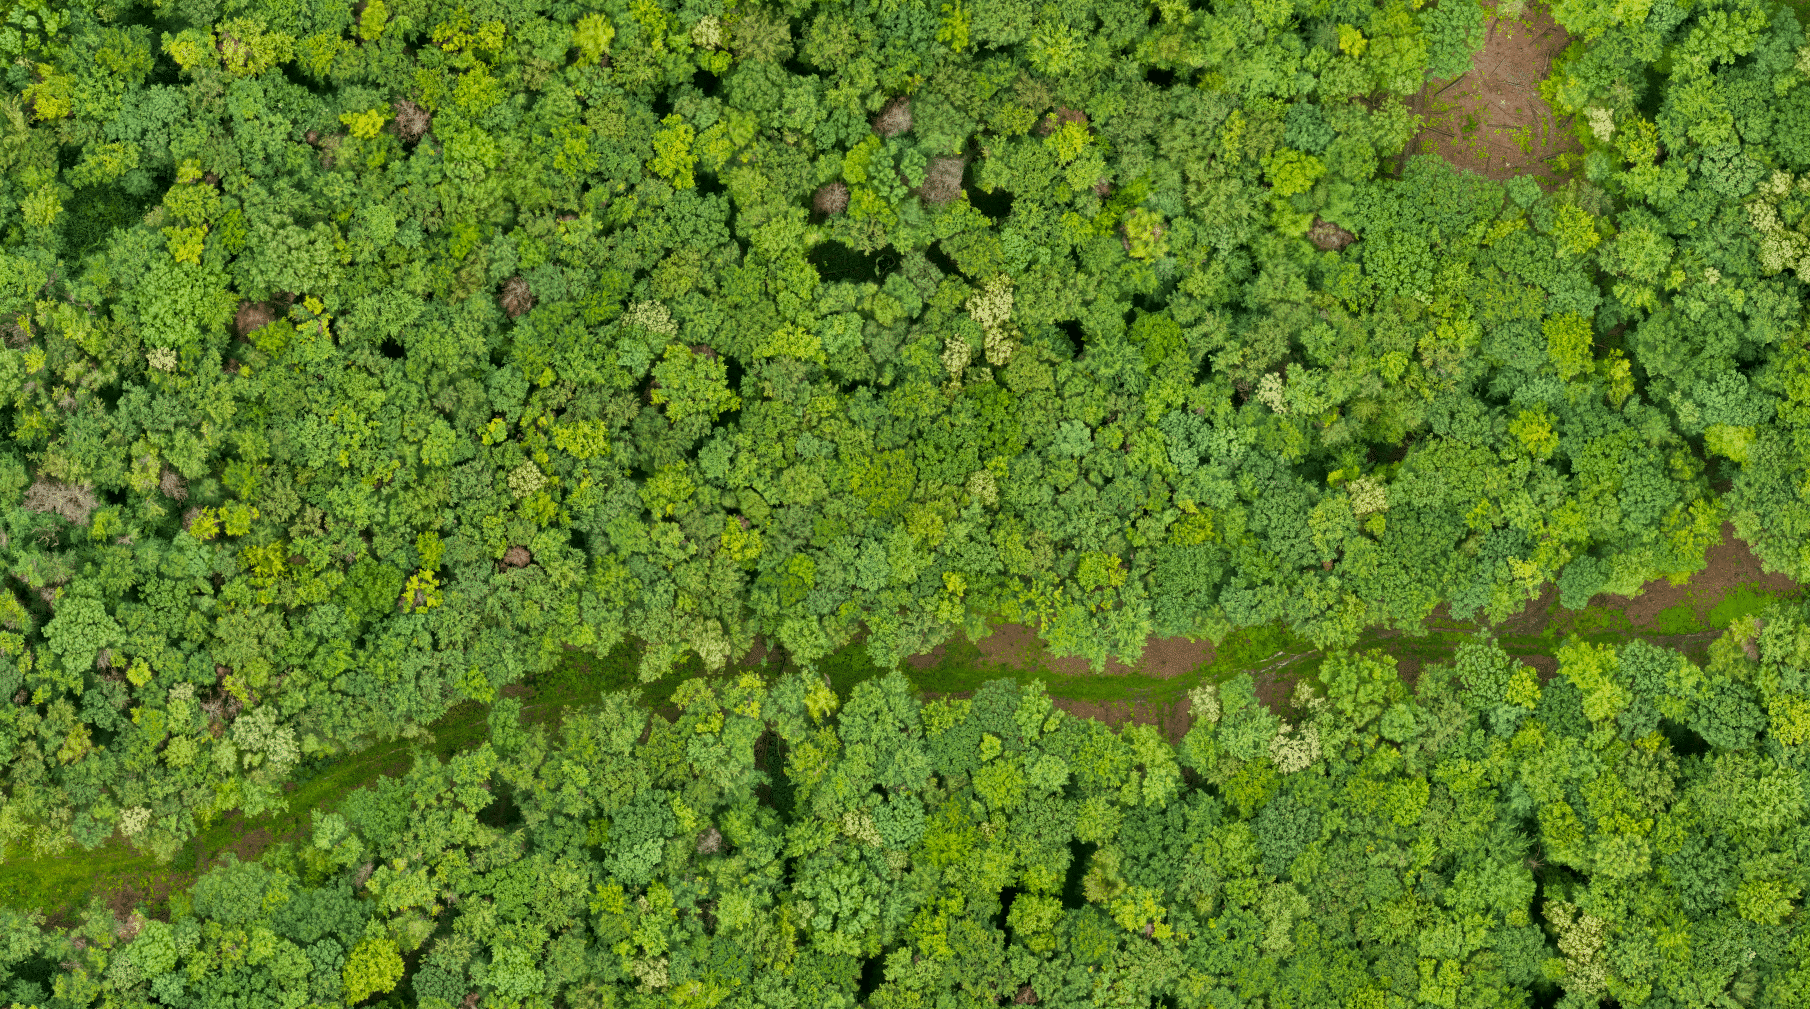
The objective of the remote sensing component is to complement the large-area collection of meterological variables with area-wide remote sensing coverage in the three exploratories. By providing and updating geospatial data and other products – derived from remote sensing data – as ready-processed Analysis Ready Data (ARD), it should be possible for non-remote sensing scientists to integrate spatial and temporal analyses based on remote sensing observations into their research and thus gain new insights into the functional relationships at different scale levels of biodiversity. For this purpose, a remote sensing infrastructure has been established in the core project and will be presented in the following.
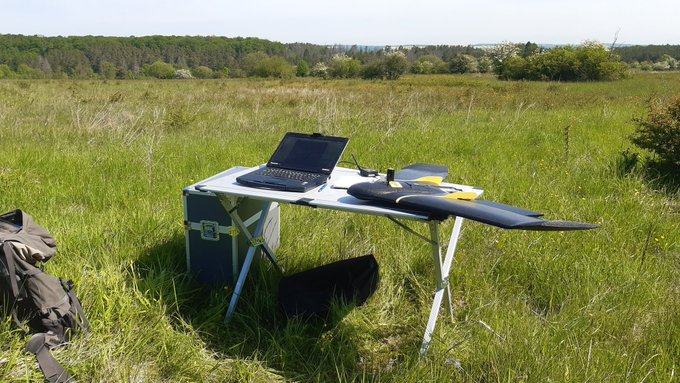
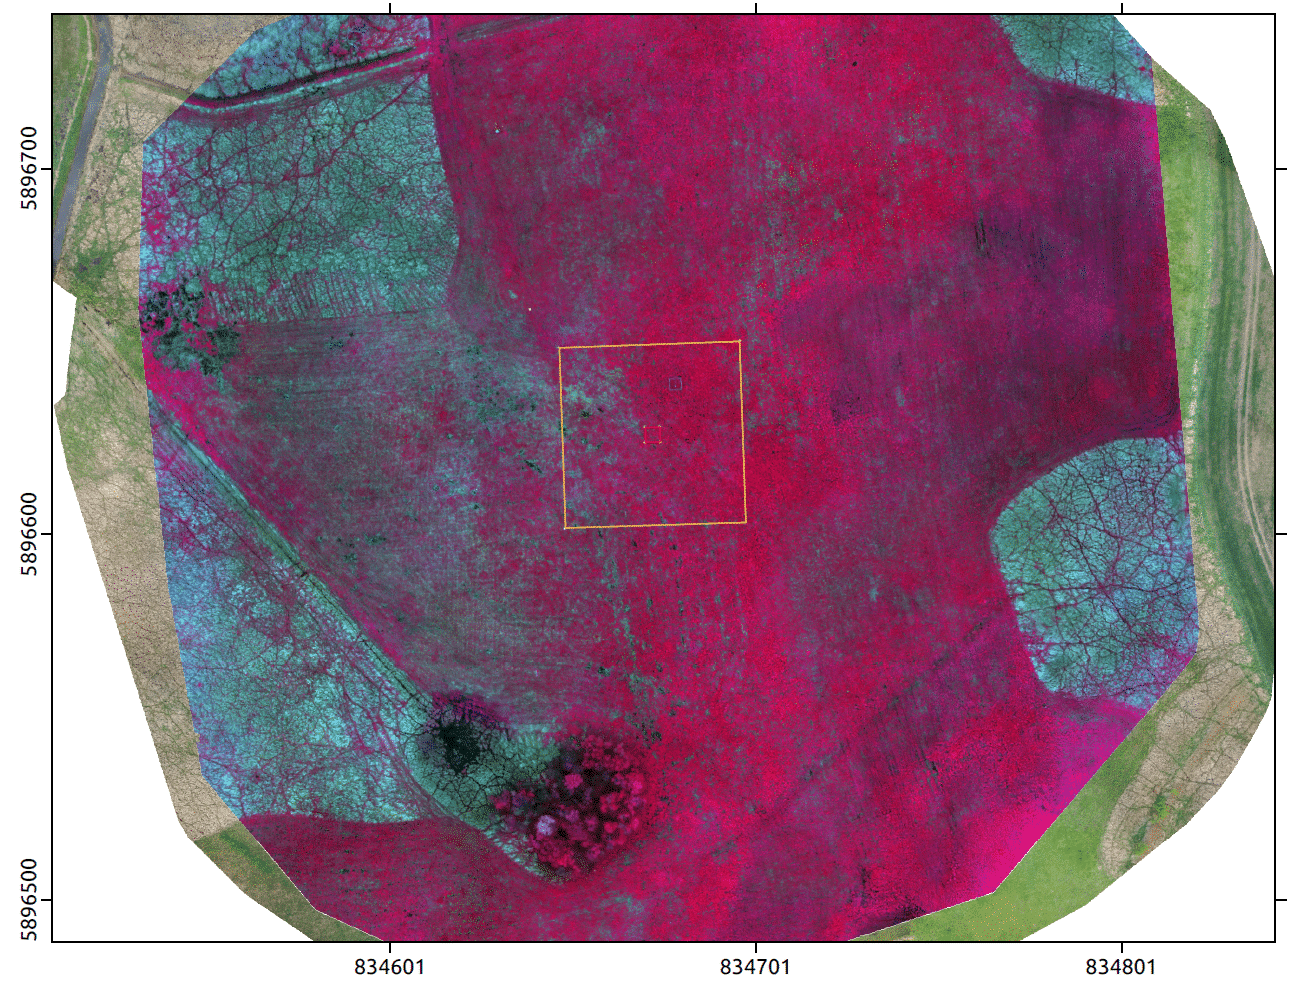
Unmaned Aerial Systems (UAS) offer the possibility of temporally flexible high-resolution images of smaller areas (plots + environment). This is especially useful when image acquisition is to be synchronized with a particular field acquisition, e.g. to develop image classification models. Thus, both (1) the plot state can be documented during the field recordings and (2) training data can be collected for the development of classification models. The very high spatial resolution of the drone imagery allows the detection of very small features. Since 2017, the core project has been conducting drone aerial surveys of the exploratories. For this purpose, the project has several drones (copters, fixed-wing aircraft) and different sensors (thermal, RGB, multi-spectral, hyperspectral) at its disposal. At the same time, Core Project 3 has established the necessary computer hardware and software and developed specialized data processing chains .
The use of drones, however, is subject to strict legal requirements which often require special permits, especially in nature conservation areas. In cooperation with the nature conservation authorities, the Core Project 3 was able to develop good solutions in many cases that allow the use of drones even in sensitive areas.
Satellite and aircraft data
To address the diversity of research questions and methods within the Biodiversity Exploratories, a wide range of remote sensing platforms are used in addition to drones. These range from optical satellite imagery (e.g. Pléiades, RapidEye, Planet, Sentinel-2) to airborne hyperspectral and LiDAR sensors as shown in Table 1.
| System | Plattform | Spatial Resolution (m) | Number of bands | Spectral resolution(μm)Spektrale Auflösung (μm) | Temporal resolution | Coverage |
|---|---|---|---|---|---|---|
| RapidEye | Satellit | 5 | 5 | 0.44 – 0.85 | 2009-2015 ~ min. three phenological periods per year | area-wide |
| Planet | Satellit | 3.5 | 4 | 0.44-0.88 | 2020-2021, saeveral recordings per year | area-wide |
| Landsat* | Satellit | 15 – 120 | 4 - 8 | 0.43 – 12.5 | 1972 - 2014, ~ annually | area-wide |
| MODIS** | Satellit | 250 – 1000 | 36 | 0.40 – 14.39 | 2001 - 2014, ~ daily | area-wide |
| Sentinel-2 | Satellit | 10-20 | 13 | 0.49-2.2 | 2016-,~ every five days | area-wide |
| Pléiades | Satellit | 0.5– 2 | 5 | 0.43 – 9.40 | unique (2015) | 100 km² per exploratory |
| Hyperspektral | Plane | 1 | > 200 | 0.40 – 2.40 | unique (2015) | 100 km² per exploratory |
| LiDAR | Plane | ~14 points/m² | Full wave form | --- | unique (2015) | 100 km² per exploratory |
Databases and processing
Climate data
The climate measurement facilities described above record >70,000 readings daily in each research area. These are automatically transmitted to Marburg via the mobile network and collected in the climate data time series database TubeDB (https://environmentalinformatics-marburg.github.io/tubedb/), which was specially developed for the exploratories. The researchers can use these processed climate data directly via BExIS and visualize and export them according to individual requirements, such as quality correction, temporal aggregation and interpolation.
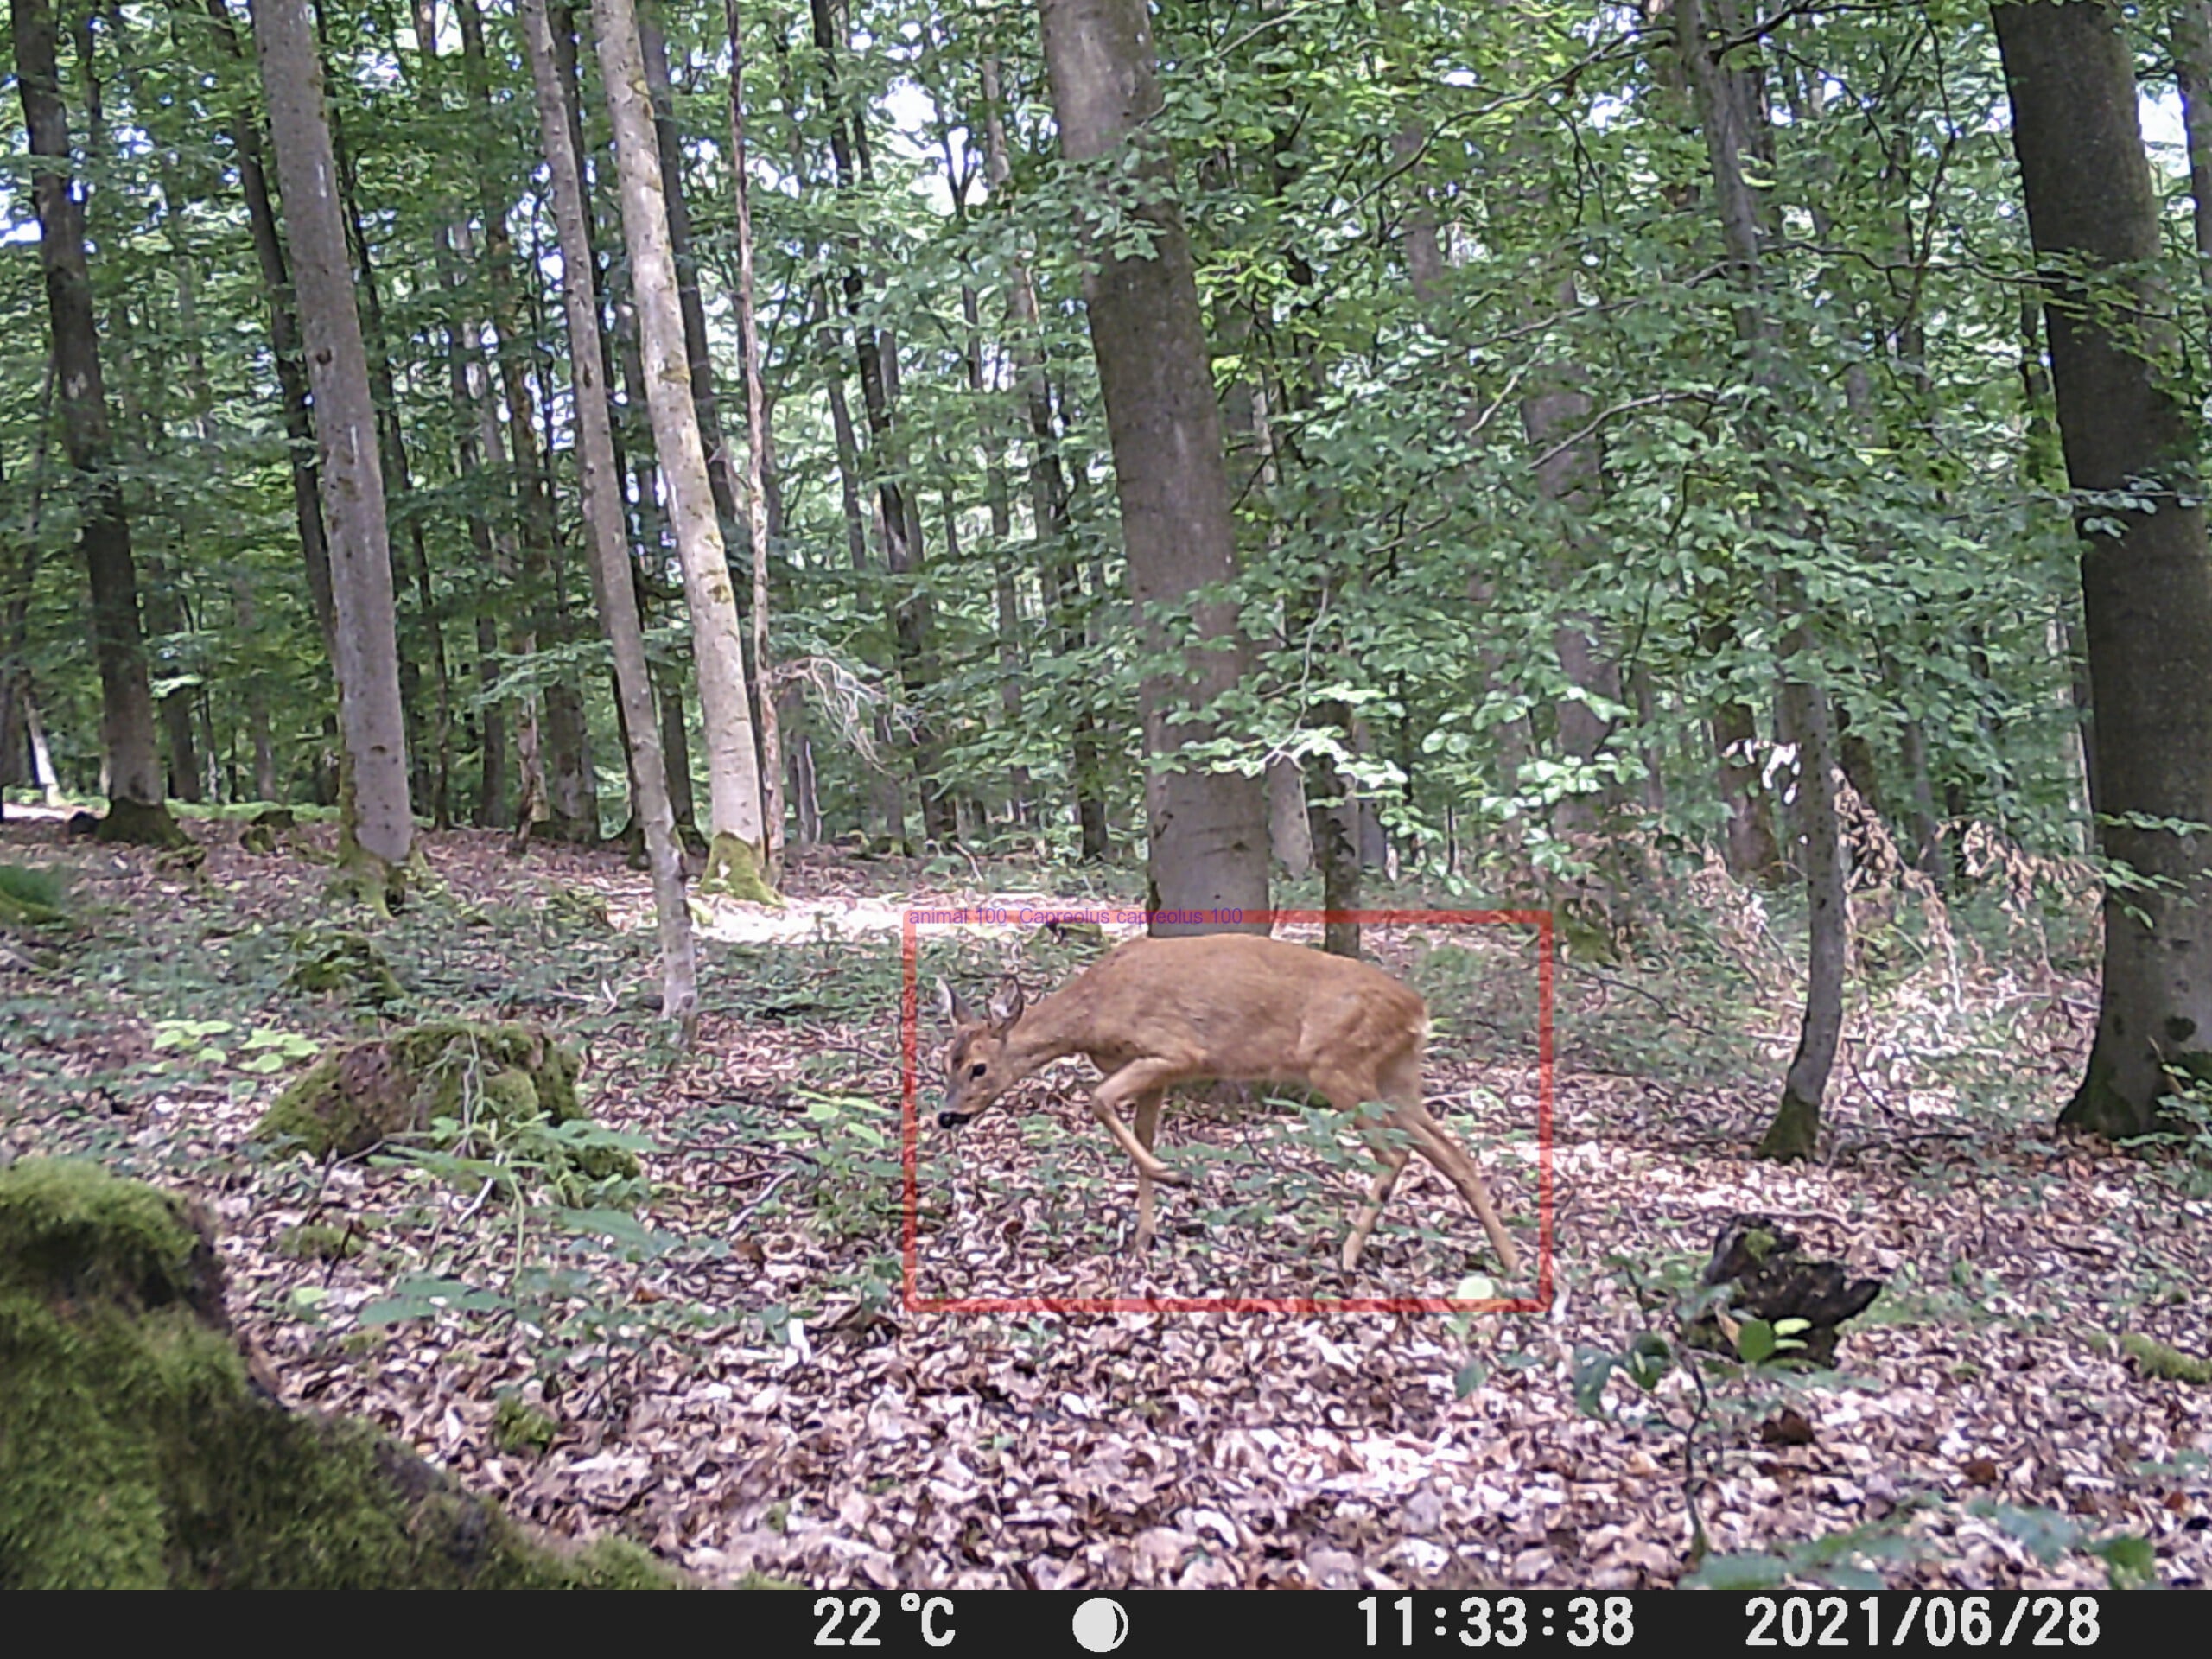
Wildlife Cameras
We undertake the processing of wildlife camera images, primarily capturing the occurrence of mammals. The processing categorizes the images into images of animals, humans, and misrecorded images. The position of animals in the images is marked so that subsequent manual or machine species identification is simplified. Our image management software enables the review of the categorized images and the manual identification.
Audiodata
Our audio data management software is the central collection place for the recorded audio data. In the web interface recordings can be listened to, visualized as spectrum The machine learning (ML) based automatic labeling runs in cycles of initial manual labeling, ML training, manual evaluation of the automatically generated labels and renewed ML training.
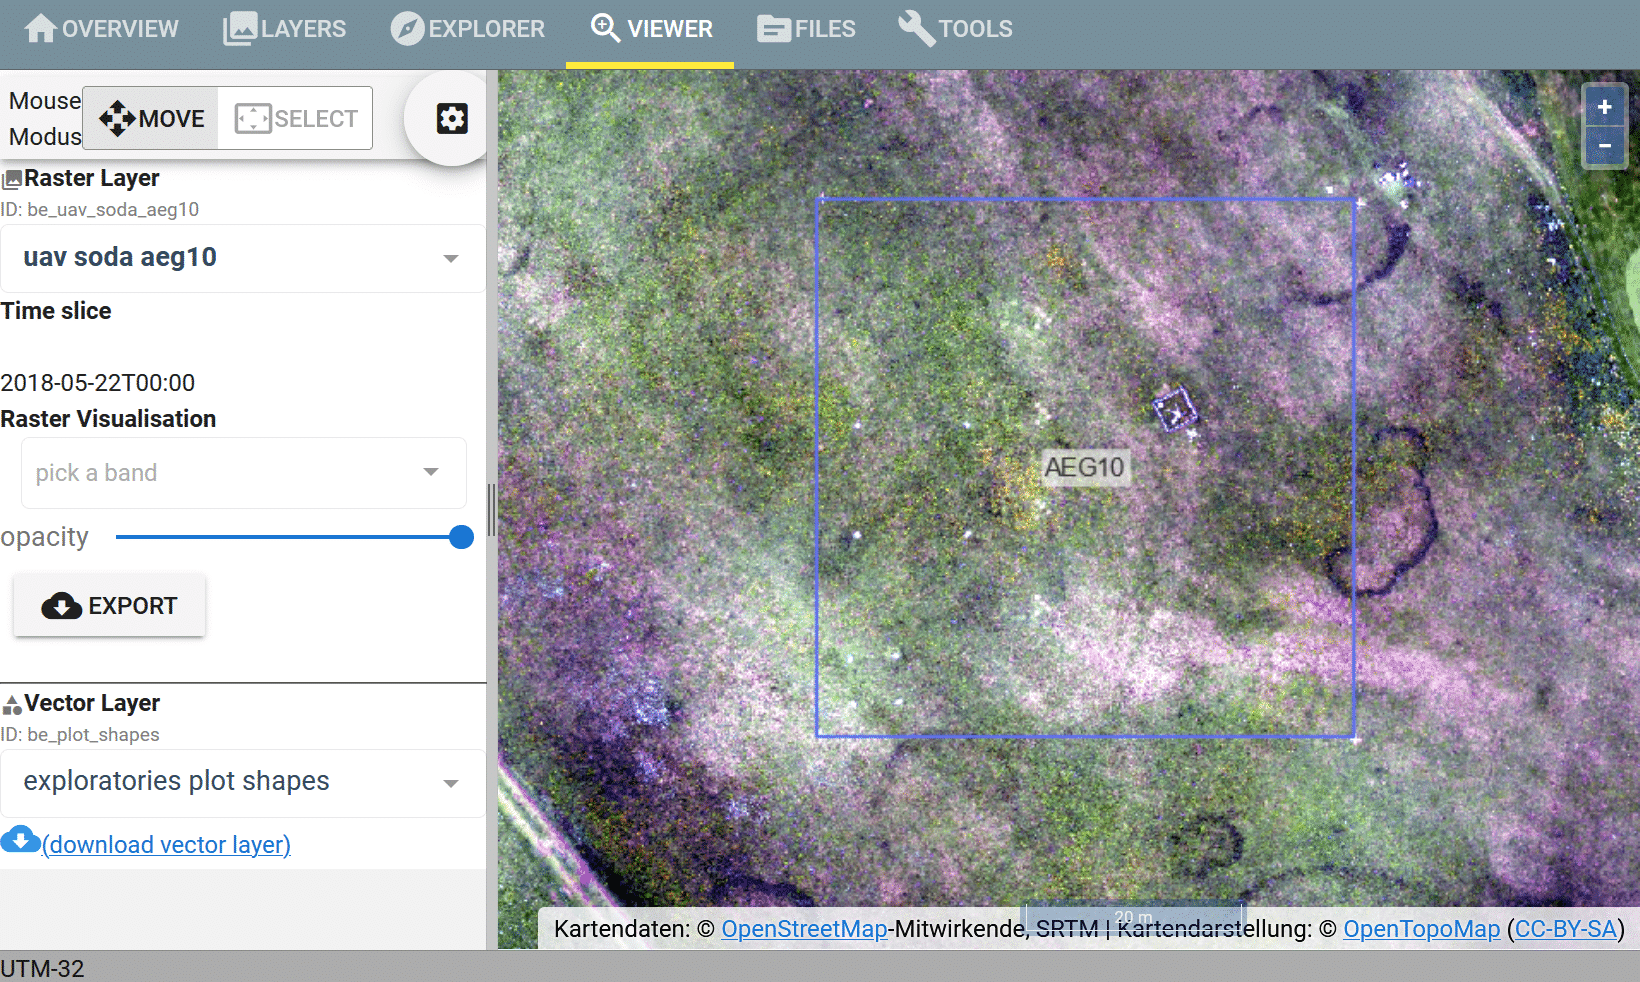
Remote sensing data
The remote sensing database RSDB, (https://environmentalinformatics-marburg.github.io/rsdb/) manages the processed raster data, point clouds and vector data. The web interface provides functions for searching and exploring the stored geodata interactive visualizations, processing and data export. In addition, all data of the RSDB can be processed directly in R via the R package rsdb (https://github.com/environmentalinformatics-marburg/rsdb/tree/master/r-package).
Current phases (2023-2026)
Services / Helpdesk
We continue our individual consultation on environmental and geospatial data acquisition. Workshops, trainings and documentation are offered to support and foster the utilization of existing datasets and analytical tools.
Management and operation of the environmental sensor network
The climate station network is maintained and modernized, collecting continuous climate data, e.g. temperature, radiation, precipitation, soil moisture, barometric pressure, wind direction and velocity.
Management and development of database modules for analyzing environmental sensor and geospatial data
New remote sensing datasets are integrated into the Remote Sensing Database (RSDB). RSDB is extended by graphical and programmatic user interfaces for on demand calculation of landscape metrics and other biodiversity indicators for customized areas.
Processing of climate data is continued so that gap-free time series can be provided via the climate database TubeDB.
In this phase we will also integrate AI-based methods for analyzing audio data (e.g. bird call classifications and soundscape metrics) into the already existing audio database (AudioDB).
We will compute wall-to-wall microclimate maps using the large climate station network under consideration of the local topography and land use.
Acquisition and processing of remote sensing and land use / cover data
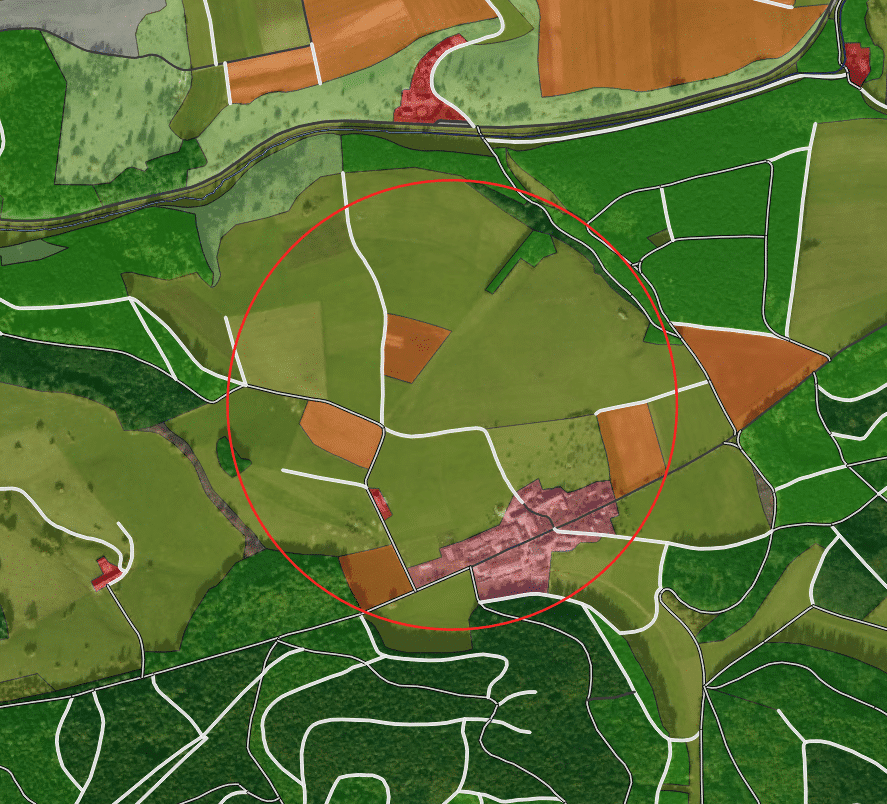
We refine and update the ATKIS land use data in plot surroundings with focus on mapping road types, skid trails and pathways.
Small woody features as important landscape structure elements are mapped for all Exploratories.
We continue the time series of Copernicus satellite images (Sentinel-1 (radar) and Sentinel-2 (multispectral) and derive spectral-temporal metrics.
We establish a time series of the new German hyperspectral satellite EnMAP which enables the exploration of optical data in a high level of spectral details.
We use drone-based laser scanning from above and terrestrial laser scanning from below to build a complete spatial 3D model of all forest plots of the FOX experiment.
Public Datasets
Non-public datasets

Management and operation of the environmental sensor network
Acquisition and processing of remote sensing and land use / cover data
Management and development of database modules for analyzing environmental sensor and geospatial data
Technical processing in the exploratories